

1. Introduction
Because most construction accidents are associated with workers’ unsafe behavior, more attention has been paid to the determinants of workers’ safety behavior (Waehrer et al., 2007; Meliá et al., 2008; Sacks et al., 2009). Recently, some researchers have testified that social factors such as group norms play a critical role in shaping workers’ safety behavior (Glendon and Litherland, 2001; Zhang and Fang, 2013; Goh and Binte Sa’adon, 2014). In this vein, safety management policies overlooking the social aspect may not induce effects as much as intended or may cause an adverse effect. Despite the importance of social aspects in workers’ safety behavior, research on the psychological mechanisms underlying the link between social influence and safety behavior is scarce. In addition, the characteristics of the construction workforce, such as the complex organizational hierarchy, have presented significant hurdles in studying the effect of social influence on construction workers’ safety behavior.
To address these issues, this study aims to explore the system-level effect of social influence on workers’ safety behavior using experimental analysis with agent-based model simulations (ABMS) to extend the knowledge of the social aspects of construction workers’ safety behavior. To understand the social aspect of workers’ safety behavior, a causal process model of individuals’ safety behavior, which represents the social influence mechanism regarding safety behavior, was developed. An experimental analysis was performed to identify the effect of various safety management policies on construction worker's safety behaviors by running simulations with an agent-based model. The following questions were addressed through this study: (1) what is the mechanism of social influence in construction workers’ safety behaviors? (2) How can the social influence of construction workers’ safety behavior be used to reduce workers’ unsafe behaviors (i.e., strictness of safety rule, frequency of managers’ feedback, and stimulation of project identification)?
2. Theoretical Background
In this study, Ajzen (1991)’s theory of planned behavior (TPB) is applied as a theoretical background. TPB has been widely applied in many areas such as traffic safety, health interventions, adolescent behavior, food safety, and information security to explain individuals’ intentional behaviors (Goh and Binte Sa’adon, 2014). Because construction workers’ unsafe behaviors, such as violations of safety rules, are also intentional behaviors, the theory of planned behavior will be useful in explaining the psychological mechanism of construction workers’ safety behavior. The TPB stipulates that an individual’s behavior is a direct function of behavioral intention and perceived behavioral control (PBC). In addition, behavior intention is determined by attitude, subjective norm, and perceived behavioral control. According to TPB, attitudes refer to the evaluation of a behavior that could be favorable or unfavorable. Subjective norms describe individuals’ perceived pressure from significant others to perform a specific behavior. Perceived behavioral control is a reflection of an individual’s perception of his/her ability to perform a stipulated behavior. Although the TPB is widely applied to explain an individual’s intentional behavior in many areas, there are several limitations to directly applying the TPB to construction workers’ safety behavior.
First , the TPB does not consider different sources of social influence. The TPB views subjective norms as a unitary construction. However, construction workers’ safety behaviors are influenced not only by workgroup norms but also by project norms. Construction workers perceive an acceptable level of unsafe behavior by observing the manager’s feedback on their particular unsafe behaviors. For example, if managers ignore a specific unsafe behavior, the behavior is retained as acceptable behavior. Therefore, the manager’s influence on workers’ safety behavior needs to be considered. In addition, although the TPB model and related empirical results have shed some light on the extent to which workers’ group norms, attitudes, and actual safety behavior are associated, the mechanisms for their interactions remain unclear.
Social Identity Theory (SIT) provides a plausible explanation for how people form/change their behaviors in social contexts. According to SIT, the effects of subjective norms depend on whether or not the person identifies with the target group (Terry et al., 1999). In other words, social norms should have a significant impact on individuals’ intentions, particularly for those who strongly identify with the group (Ashforth and Mael, 1989; Terry and Hogg, 1996; Hogg and Terry, 2000; Hornsey, 2008). Previous research empirically supports the claim that ingroup norms are usually a more powerful determinant of behavior than outgroup norms (Smith and Louis, 2009). Therefore, the effect of social norms needs to be considered, and workers’ level of social identification with the group can be an important moderating factor of the influence of different group norms.
3. Method
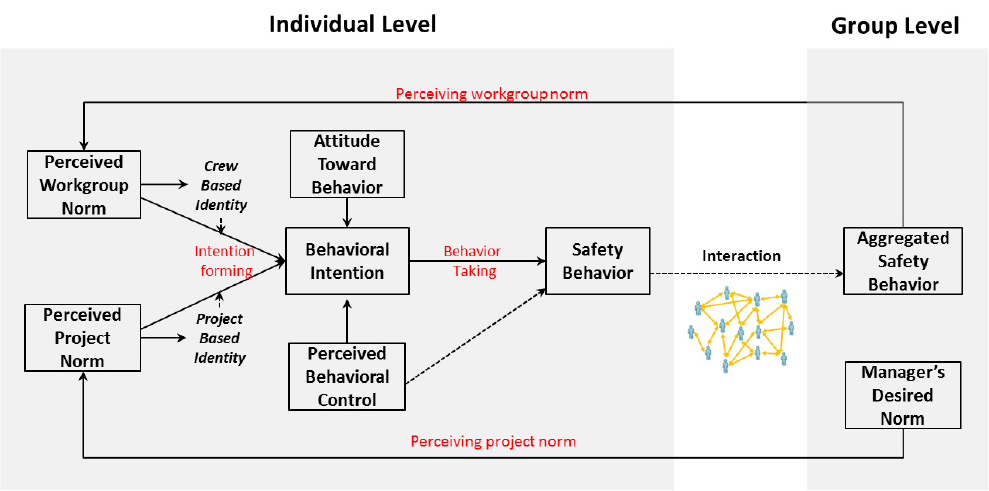
Based on the discussion so far, this study developed a conceptual framework, as shown in Fig. 1. In this model, workers’ safety behavior is a direct function of behavioral intention and perceived behavioral control, as discussed in the TPB. The behavioral intention is determined by attitude, perceived behavioral control, and social pressure. Social pressure in this model is divided into workgroup and project norms to reflect different sources of social influence on workers’ safety behavior. In this framework, the observation of crew members’ safety behavior is the source for perceiving workgroup norms. In addition, the observation of managers’ feedback on safety behavior of workers in other crew members is the source of perceiving the project norms. Finally, two types of social identity, crew- and project-based, were adopted to consider the moderating effect of social influence in this model.
These behavioral rules for the agents are formalized as mathematical equations for use in the agent-based model as follows;
Equations (1), (2), (3) are the translations of behavior taking, behavioral intention form, and perceiving social norms in the conceptual framework. The behavior taking step is embedded in Equation (1), where is time (e.g., day); is worker i’s safety behavior at time t (0‒1); is worker i’s behavioral intention at time t (0‒1); is worker i’s perceived behavioral control at time t (0‒1); weighting factors for behavioral intention (0‒1). Equation (2) represents the formation of behavioral intention based on attitude, perceived behavioral control, workgroup norms, and project norms; is worker i’s attitude at time t; is group j’s safety norm perceived by worker i at time t; is a weighting factor for attitude; is the salience of group j in worker i’s mind at time t; is worker i’s level of norm compliance. Operationally, does not exceed 1. Finally, norm perceiving process is embedded in Equation (3); where is worker i’s memory capacity; is the number of workers in group j observed by worker i at time t.
The salience of a particular social identity is determined by the interaction between relative accessibility and fit (Turner et al., 1987; Oakes et al., 1991; Blanz, 1999). According to social identity theories, accessibility refers to the relative readiness of a perceiver to accept or retrieve a particular self-category. Therefore, identities that are more familiar or carry emotional valence are more accessible (Kopecky et al., 2010; Dimas and Prada, 2014). This study applied Dimas and Prada (2014)’s equation for accessibility, as shown in Equation (4) and (5).
where is the accessibility of group j in worker i’s mind at time t; is the emotional valence of group j in worker i’s mind at time t.
In addition, fit reflects the extent to which a particular context activates particular identities (Kopecky et al., 2010). The fit of a particular identity is determined by similarities within categories and differences between categories (Hogg and Terry, 2000; Hogg and Reid, 2006). In this model, the weighted average of similarity within the group and the difference between groups is used for fit, as shown in Equation (6). is weighting value for similarity within the group, and since this study wants to give more weight to ingroup similarity, this study defaults .8.
where is the fit of a particular group j in worker i’s mind at time t; is average behavior of the ingroup at time t; is average behavior of the outgroup at time t; is the ingroup member worker i at time t; is number of workers in ingroup i.
4. Results and Discussion
Before performing model experiments to answer the research questions raised in this study, a qualitative agreement between the results of the simulation and the empirical findings of the previous literature was examined to confirm the validity of the model. In the model experiment, a construction project with 10 crews, each of which has 10 workers, is simulated. In the model, the space is a two-dimensional rectangular grid and is divided into 10 clusters, which are space for a specific crew. Mangers in the model do not have any spatial restrictions regarding their location, and their safety behavior level is consistent with the strictness of safety rules in the model. Therefore, observing managers’ safety behavior describes the manager’s feedback during the construction project. In addition, the number of managers in the model represents the frequency of managers’ feedback rather than the actual number of managers in the project. The strictness of the safety rule was set to.85, and the number of managers was set to 20 for the simulation run. Every worker is distributed to their crew’s cluster and then observes their neighbors’ behaviors. The observed behaviors are stored in the memory, and each worker in the simulation can remember 50 cases of their neighbors’ behavior. Among the stored behaviors, the crew members’ behaviors are the source of the perceived workgroup norm, and the mangers’ and other crew members’ behaviors are the source of the perceived project norms. Then, the workers determine the level of social identification with the crew and project based on the fit and accessibility of each group. At the beginning of the simulation run, workers are initialized with an attitude that is randomly assigned based on uniform distribution from .4 to .7, and with a perceived behavioral control from .4 to .6. Finally, the values of weight to attitude and weight to intention are determined as.7 and.85, respectively, based on the regression coefficient of attitude and intention in Zhang and Fang (2013)’s structural equation model.
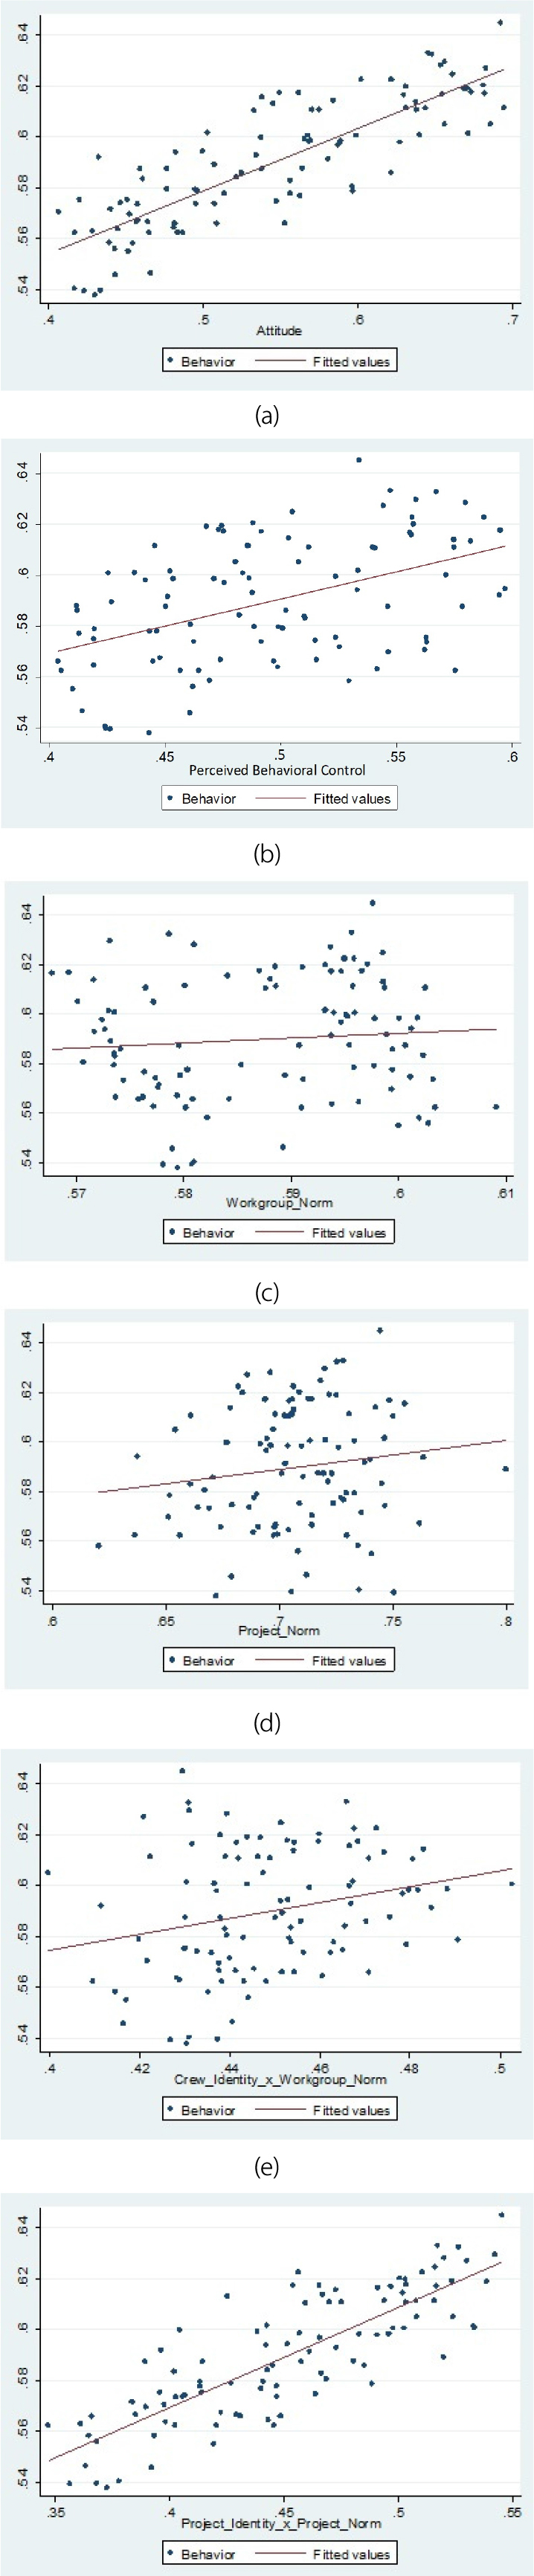
To test qualitative agreement, scatter plots of the simulation results are shown in Fig. 2. Fig. 2(a)‒(d) represent the relationship between safety behavior and attitude (Fig. 2(b)), workgroup norms (Fig. 2(c)), and project norm 2(d)). Fig. 2(e) and 2(f) demonstrate the relationship between safety behavior and workgroup norm x crew identity (Fig. 2(e)) and project norm x project identity (Fig. 2(f)). As shown in the Fig. 2(a)‒(d), the simulation results of the model reaffirm the empirical findings from previous TPB studies that attitude, social norm, and perceived behavior control are associated with individuals’ behavior. In addition, Fig. 2(e) and 2(f) represent stronger relationships than Fig. 2(c) and 2(d), and the effects of social identities on group norms influence as described in the social identity literature.
Then, to address the research questions that were raised, the impact of principal parameters (i.e., strictness of safety rule, frequency of managers’ feedback, and stimulation of project-based identity) on the dynamics of organizational-level safety behaviors was explored. These parameters refer to diverse managerial actions to improve workers’ safety behavior at the construction site. For example, strict safety rules can increase the level of project safety norms and improve workers’ safety behavior. In the case of frequency of managers’ feedback, frequent managers’ feedback can make the project norm more aligned with safety rules because the project norm is determined by managers’ feedback and observation of workers who belong to other crews. Finally, stimulation of project-based identity can lead to workers’ behavioral intention being more aligned with project norms because social identity moderates the effect of social norms on workers’ behavioral intention. However, these managerial actions also have adverse effects on workers' safety behaviors. For example, if safety rules are too strict, the social identity of workers with the project decreases because of the lower value of emotional valence. To address these dynamics, this study performed a model experiment sweeping the strictness of safety rules, frequency of managers’ feedback, and stimulation of project- based identity. Because a very low value of the strictness of the safety rule is not feasible in a real construction project, the range of the strictness of the safety rule was from .5 to 1.0 in the experiment.
Figs. 3, 4, 5 illustrate the results of the simulation experiments. Fig. 3 represents the result of the parameter sweep between the strictness of safety rules and the frequency of managers’ feedback. The x-axis in Fig. 3 represents the strictness of safety rules, and the y-axis represents the frequency of managers’ feedback. The colors at each point represent the average level of workers’ safety behaviors under each condition. As shown in Fig. 3, strict safety rules positively affect construction workers’ safety behavior. However, as the safety rule becomes stricter, the effect of the safety rule on workers’ safety behavior is reduced. Regarding the frequency of managers’ feedback, it appears that there is no effect of the frequency of managers’ feedback when safety rule is not much strict. However, as the safety rule becomes stricter, the frequency of managers’ feedback shows a positive relationship with workers’ safety behavior. This implies that the interaction effect between a strict safety rule and frequent managers’ feedback is intensified when the safety rule is strict. This is because frequent managers’ feedback aligns the project norm more closely with safety rules because workers have more opportunities to observe managers’ feedback than other workers’ behavior.
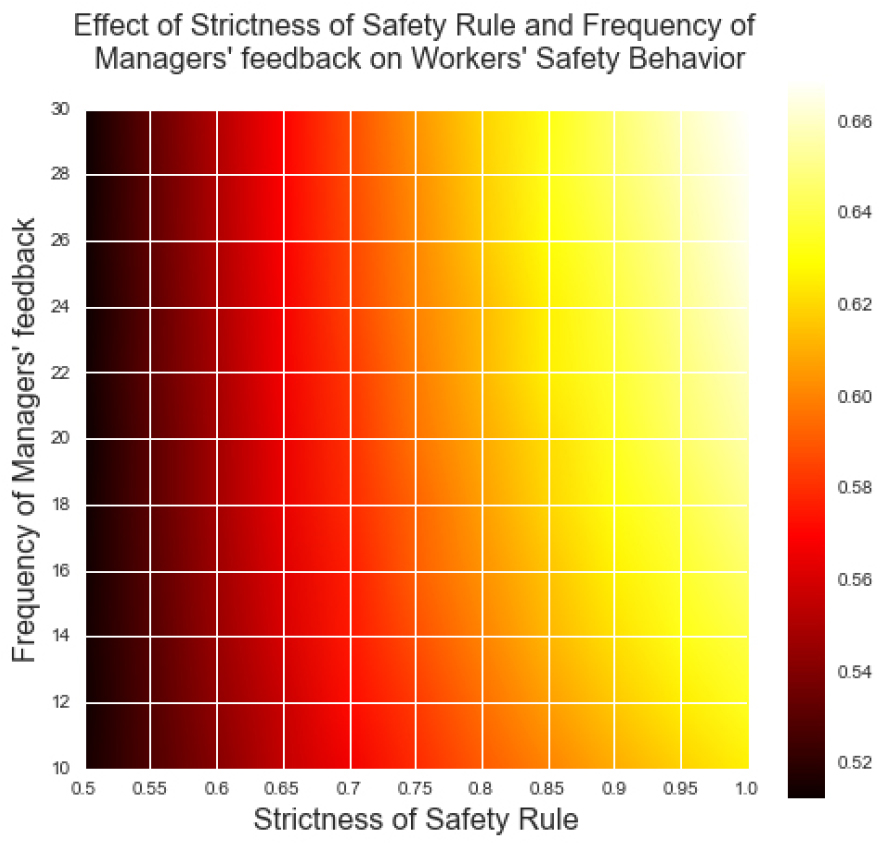
Fig. 4 shows the result of the parameter sweep between the strictness of the safety rule and stimulation of project identification. The x-axis in Fig. 4 is the strictness of the safety rule, and the y-axis is the stimulation of project identity. The colors at each point represent the average level of workers’ safety behaviors under each condition. As shown in Fig. 4, there is a positive relationship between a strict safety rule and safety behavior when the safety rule is not very strict. However, safety rules have a limited effect on workers’ safety behavior as they become more stringent. For the stimulation of project identification, it is difficult to find a relationship between the stimulation of project identification and safety behavior; however, as the safety rule becomes strict, the stimulation of project identification shows a positive relationship with workers’ safety behavior. This implies that although stimulation of project identification does not have much effect on workers’ safety behavior when safety rule is not much strict, it can create synergy as safety rules become stricter. This is because an increased project identity aligns workers more with the project norm, which is significantly related to safety rules.
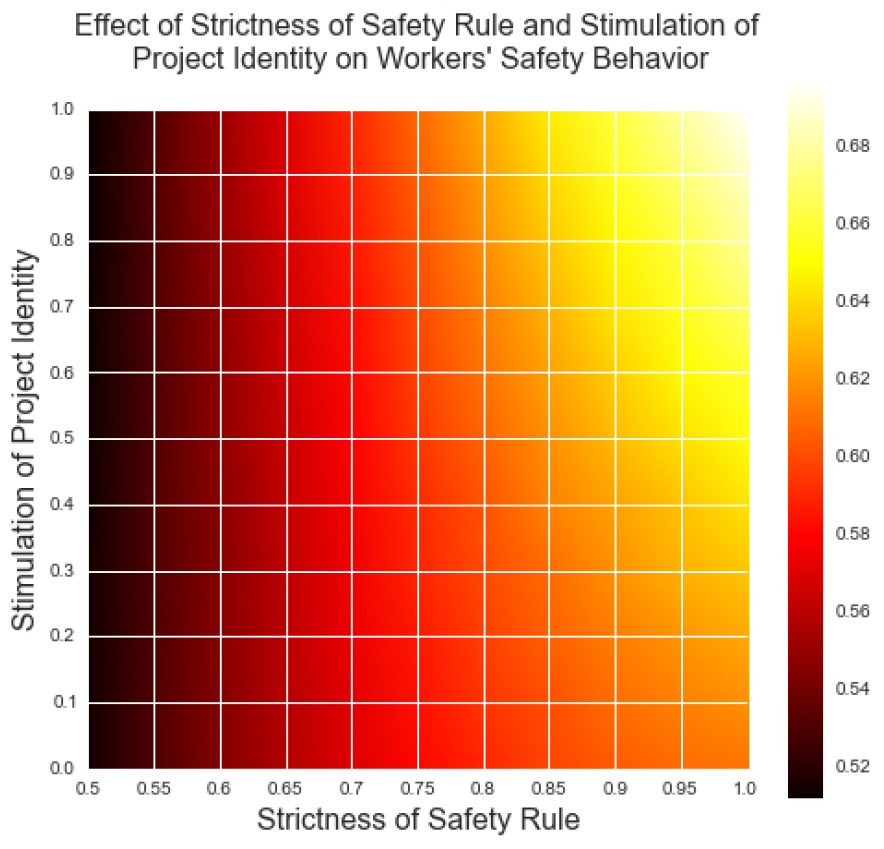
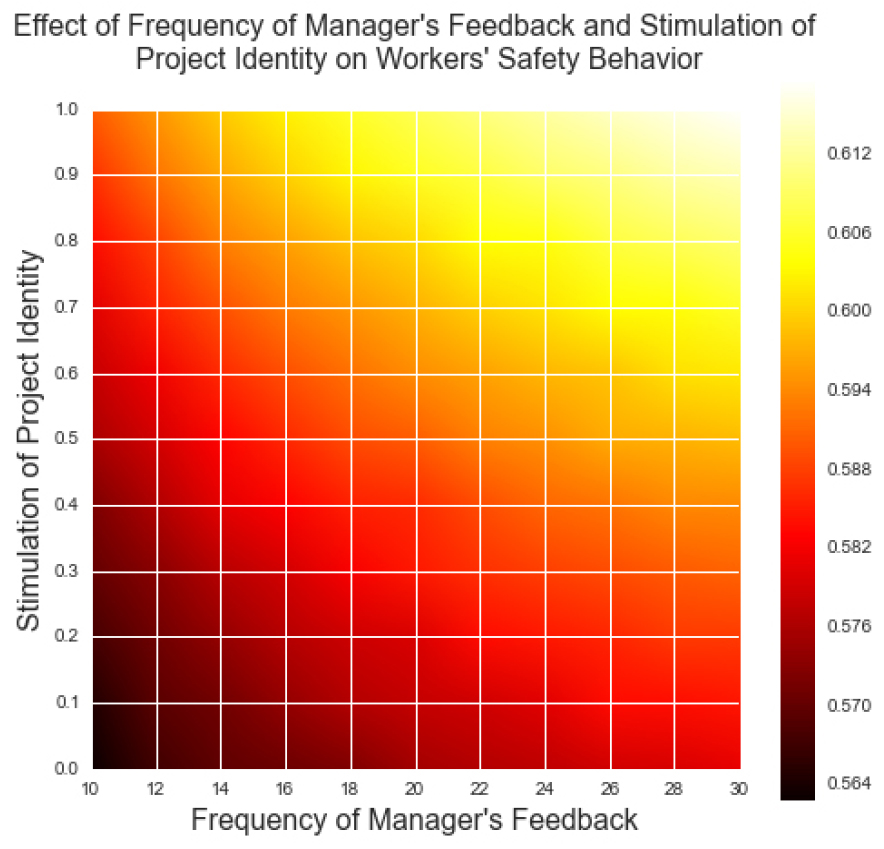
Fig. 5 shows the result of the parameter sweep between the frequency of managers’ feedback and the stimulation of project identification. The x-axis in Fig. 5 is the strictness of the safety rule, and the y-axis is the stimulation of project identification. The colors at each point represent the average level of workers’ safety behaviors under each condition. Fig. 5 describes the strong interaction effect between the frequency of managers’ feedback and stimulation of project identity on construction workers’ safety behavior.
In addition to the qualitative analysis of model experiment results, a regression analysis was performed to identify the effect of strictness of safety rules, frequency of managers’ feedback, and stimulation of project identity on workers’ safety behavior. To identify the interaction effect of stimulation of project identification and strictness of safety rules as well as stimulation of project identity and frequency of managers’ feedback, two interaction terms were included in the regression model. The results of the regression analysis are presented in Table 1. As shown in Table 1, all regression coefficients are statistically significant. However, because variables in the model do not have specified practical meaning, it is difficult to directly interpret the value of the regression coefficient, similar to general regression analysis. For example, it is difficult to interpret the exact meaning of one unit increase in the strictness of safety rules in reality. We can confirm the results of the qualitative analysis using this regression analysis.
Table 1.
Result of Multiple Regression Analysis
5. Conclusions
In this study, an agent-based model representing worker safety behavior during the process was constructed using theoretical and empirical findings. By running simulations on the model with different conditions for focused parameters, (1) a strict safety rule can work as a force to increase workers’ safety behavior; (2) when the safety rule is sufficiently strict, the frequency of managers’ feedback and stimulation of project identification can lead to an increase in workers’ safety behavior; (3) interaction between stimulation of project identification and frequency of managers’ feedback can lead to worker’s safety behavior regardless of the safety rule’s strictness. The model experiment extends our knowledge of the dynamic relationship among workers’ safety behavior, social norms (i.e., workgroup norms and project norm), social identities (i.e., crew identity and project identity), and diverse managerial actions (i.e., strictness of safety rule, frequency of managers’ feedback, and stimulation of project identification). These findings provide a firm foundation for a new view of safety management that emphasizes the socio-psychological aspects of safety behaviors.
