

1. Introduction
1.1 Background of Research
1.2 Purpose of Research
2. Literature Review
2.1 Construction ICT (Information and Communications Technology)
3. Methodology
3.1 Productivity analysis of machine guidance excavator
3.2 Unmanned Aerial Vehicle (UAV) survey and volume calculation
3.3 Extraction of technology evaluation impact factors using individual in-depth interviews and modified Delphi techniques
3.4 Valuation Analysis
4. Case Study
4.1 Process
4.2 Machine guidance application site
4.3 UAV Survey Application Site
4.4 Derivation of evaluation impact factors using semi-structured survey and modified Delphi method
4.5 AHP Analysis
5. Conclusion
5.1 Conclusion
1. Introduction
1.1 Background of Research
Many current industrial sectors are solving problems caused by high wages and declining labor force by using automation technology. However, the construction industry had more labor-intensive factors than other industries, and it was difficult to automate the industry because it was an industry related to facilities related to the life of citizens and connected to other industries in various industries. To introduce automation, the situation in which the industry is applied must be classified and predicted to have the problem-solving ability appropriate to the situation. However, due to the nature of the civil environment where various types of industries are linked in an unstructured and unpredictable field, factors that change the situation and situation can be predicted. There are so many that the introduction of automation is slow and difficult compared to other industries.
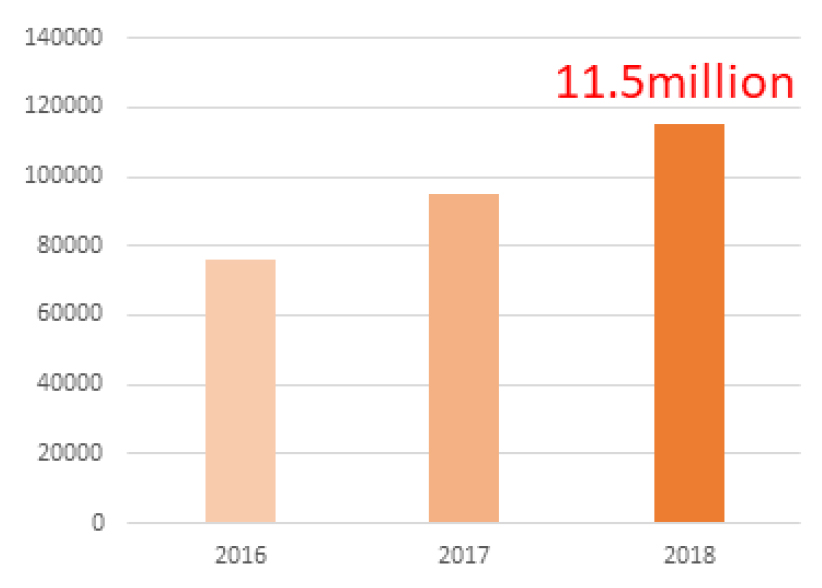
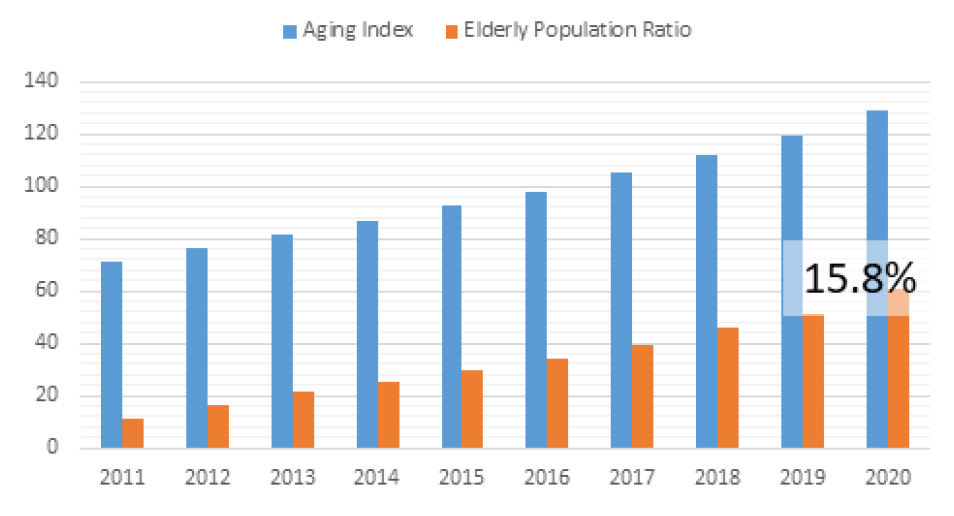
Looking at Fig. 1, the shortage of workers is expected to be 11.5 million in 2018 due to the lack of skilled workers at the construction site. It is also a big problem that the know-how of skilled workers is not transmitted. Nowadays, the labor force in the construction market is declining due to the productivity aging of the domestic construction market and the aging of workers and workers (Fig. 2).
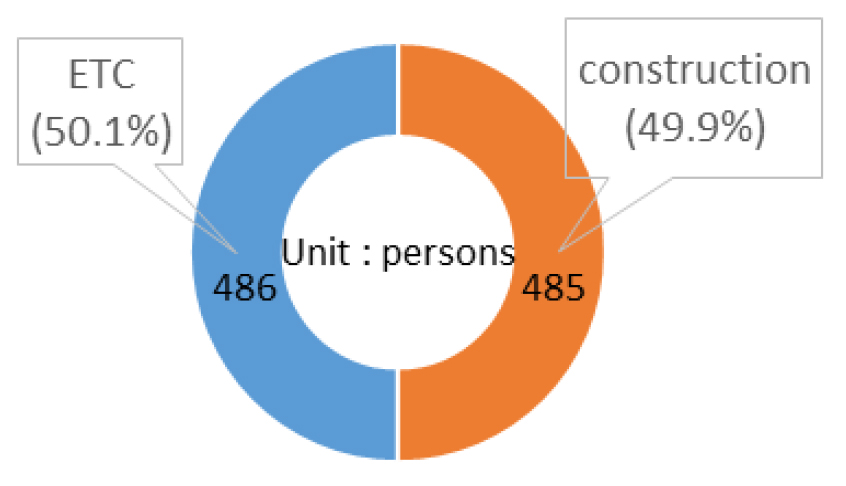
In addition, according to Fig. 3, the total number of deaths in industrial accidents in 2018 was 971, of which 485 (49.9%), were deaths in industrial accidents at construction sites. Since the construction industry has a very high risk of industrial workers compared to other industries, a solution to safety problems at the construction site is needed quickly.
The construction industry is facing a crisis due to low productivity and poor construction quality. To solve this, the government designed and constructed the core technologies of the 4th Industrial Revolution through the 6th Basic Plan for Construction Technology Promotion (2018 ~ 2022). With the vision of ‘Smart Construction 2025-Development of construction automation technology using BIM and AI until 2025’ converging in each stage of construction and maintenance, the roadmap for technology development is being materialized. From this point of view, analysis of the level of automation technology in the field of construction was conducted for construction automation experts and earthwork experts.
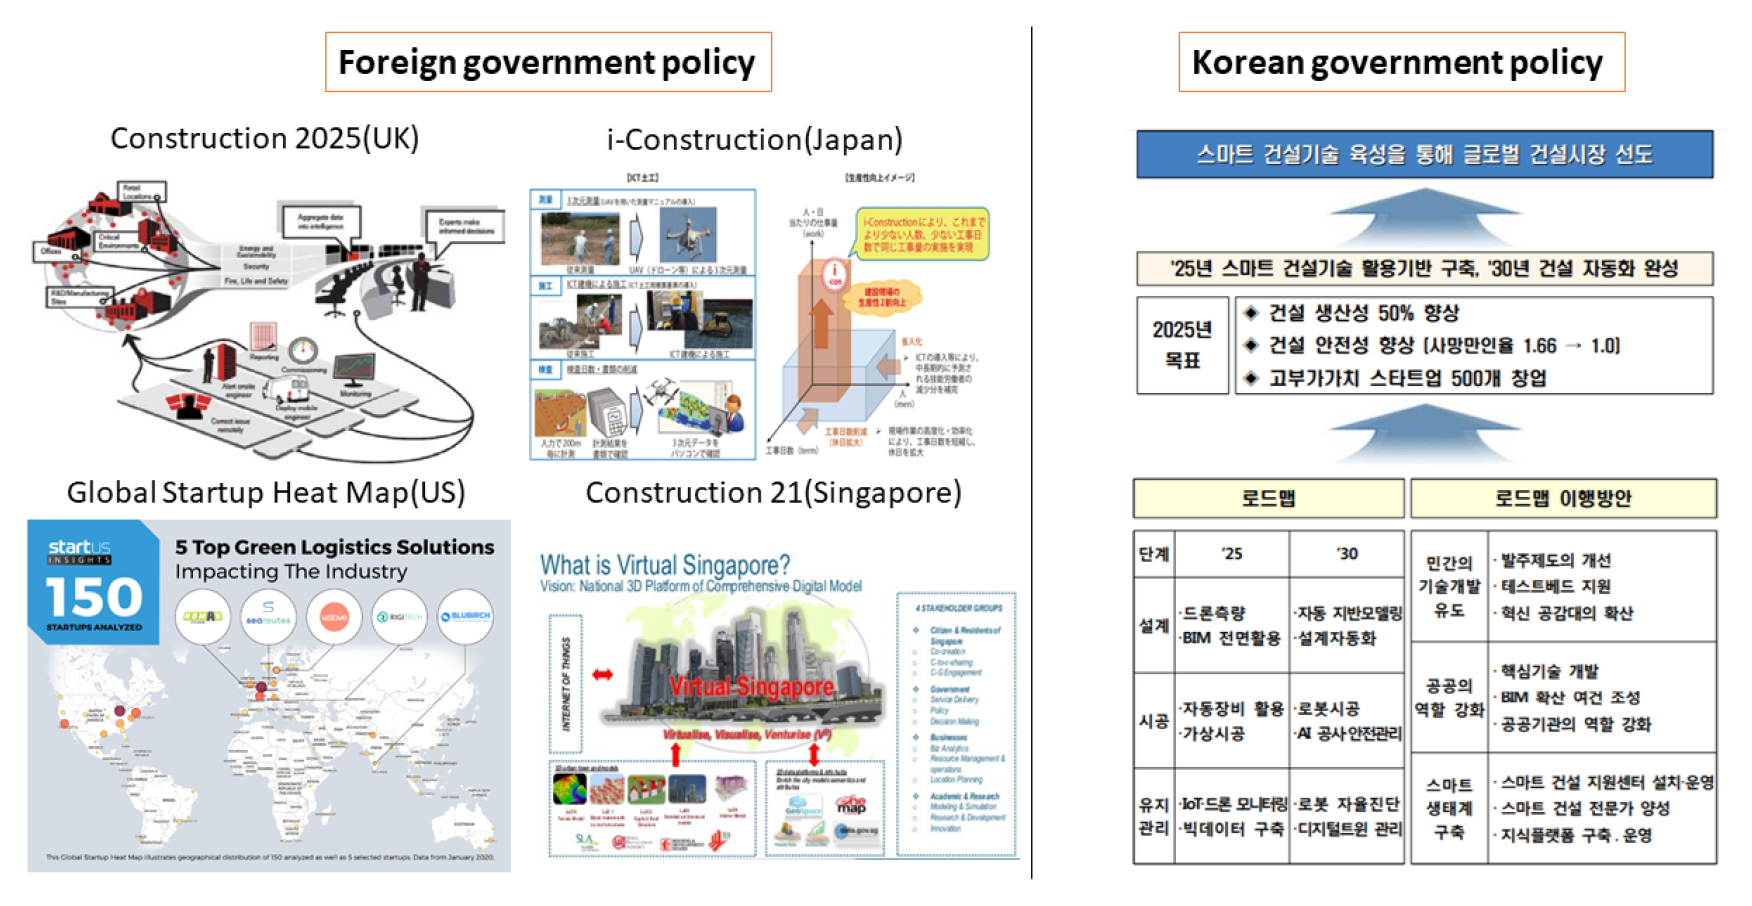
In Fig. 4, the goal of the domestic and foreign construction industry policy trend is to reduce costs, shorten the construction period, reduce greenhouse gas emissions, improve productivity and improve safety by using smart construction technology based on 4th industrial revolution technologies.
In the construction work, the earthwork sector is a major cause of productivity deterioration because it requires a lot of manpower and equipment due to information disparity between the 3D construction site and 2D design drawings, repetition of construction and inspection processes, and quality check by manpower. Complex processes, which are not standardized, have reduced efficiency, and there is a high demand for technology development for construction automation that can improve productivity and reduce construction costs. In the field of earthwork, automated element technology includes automatic calculation of earthwork volume using drone surveying, automatic analysis of soil compaction and stiffness, and government- and private-sector technology development has been in progress for the past decade (Ministry of Land, Infrastructure and Transport, 2018a).
Although it is difficult to define a smart construction technology in a standardized form, it was defined as ‘a technology that combines traditional construction technology with the 4th industrial revolution technology (Drone, BIM, Big Data, IoT, Robot, etc.)’. Accordingly, smart construction technology is a technology that innovatively changes the typical paradigm of the construction industry by applying the 4th industrial revolution technology at various stages of the construction industry such as design, construction, and maintenance. The technology is also confirmed to be highly compatible with the government’s top plan in Table 1. Through this, the construction industry intends to perform optimal design in a 3D-based virtual space at the design stage, and at the same time, to perform integrated planning and management activities considering construction and operation from the design stage. In the construction phase, the factory is manufactured and constructed without being affected by weather and civil complaints, and unskilled personnel induces equipment automation and intelligence to enable advanced work with the cooperation of various sensors and devices. In the maintenance phase, the facility information is collected in real-time and a variety of smart technologies are used to create an environment where scientific and objective analysis of the condition and performance of the facility can be performed.
Table 1.
Conformity survey with smart construction technology's top plan (Korea Institute of Science & Technology Evaluation and Planning)
1.2 Purpose of Research
With the goal of 2025, the Korean government is set to establish 50% of construction productivity, improve construction safety, and start 500 high value-added startups through monitoring using BIM in the design phase, automation equipment in the construction phase, and IoT in maintenance. According to the preliminary feasibility study report of the field application project of the smart construction technology in 2018, it was determined that it had the basic technical competency to promote the smart construction technology, but the relationship between the goal of the early construction of the smart construction machine and the performance indicators was ambiguous. This is not clearly established, and along with this, difficulties in field application have been raised. Among the smart construction technologies, equipment automation technology and UAV measurement technology are the technologies that greatly affect the improvement of construction productivity. The productivity analysis of the majority of equipment automation technology and UAV measurement technology was conducted through short-term application in an experimental environment (Fig. 5).
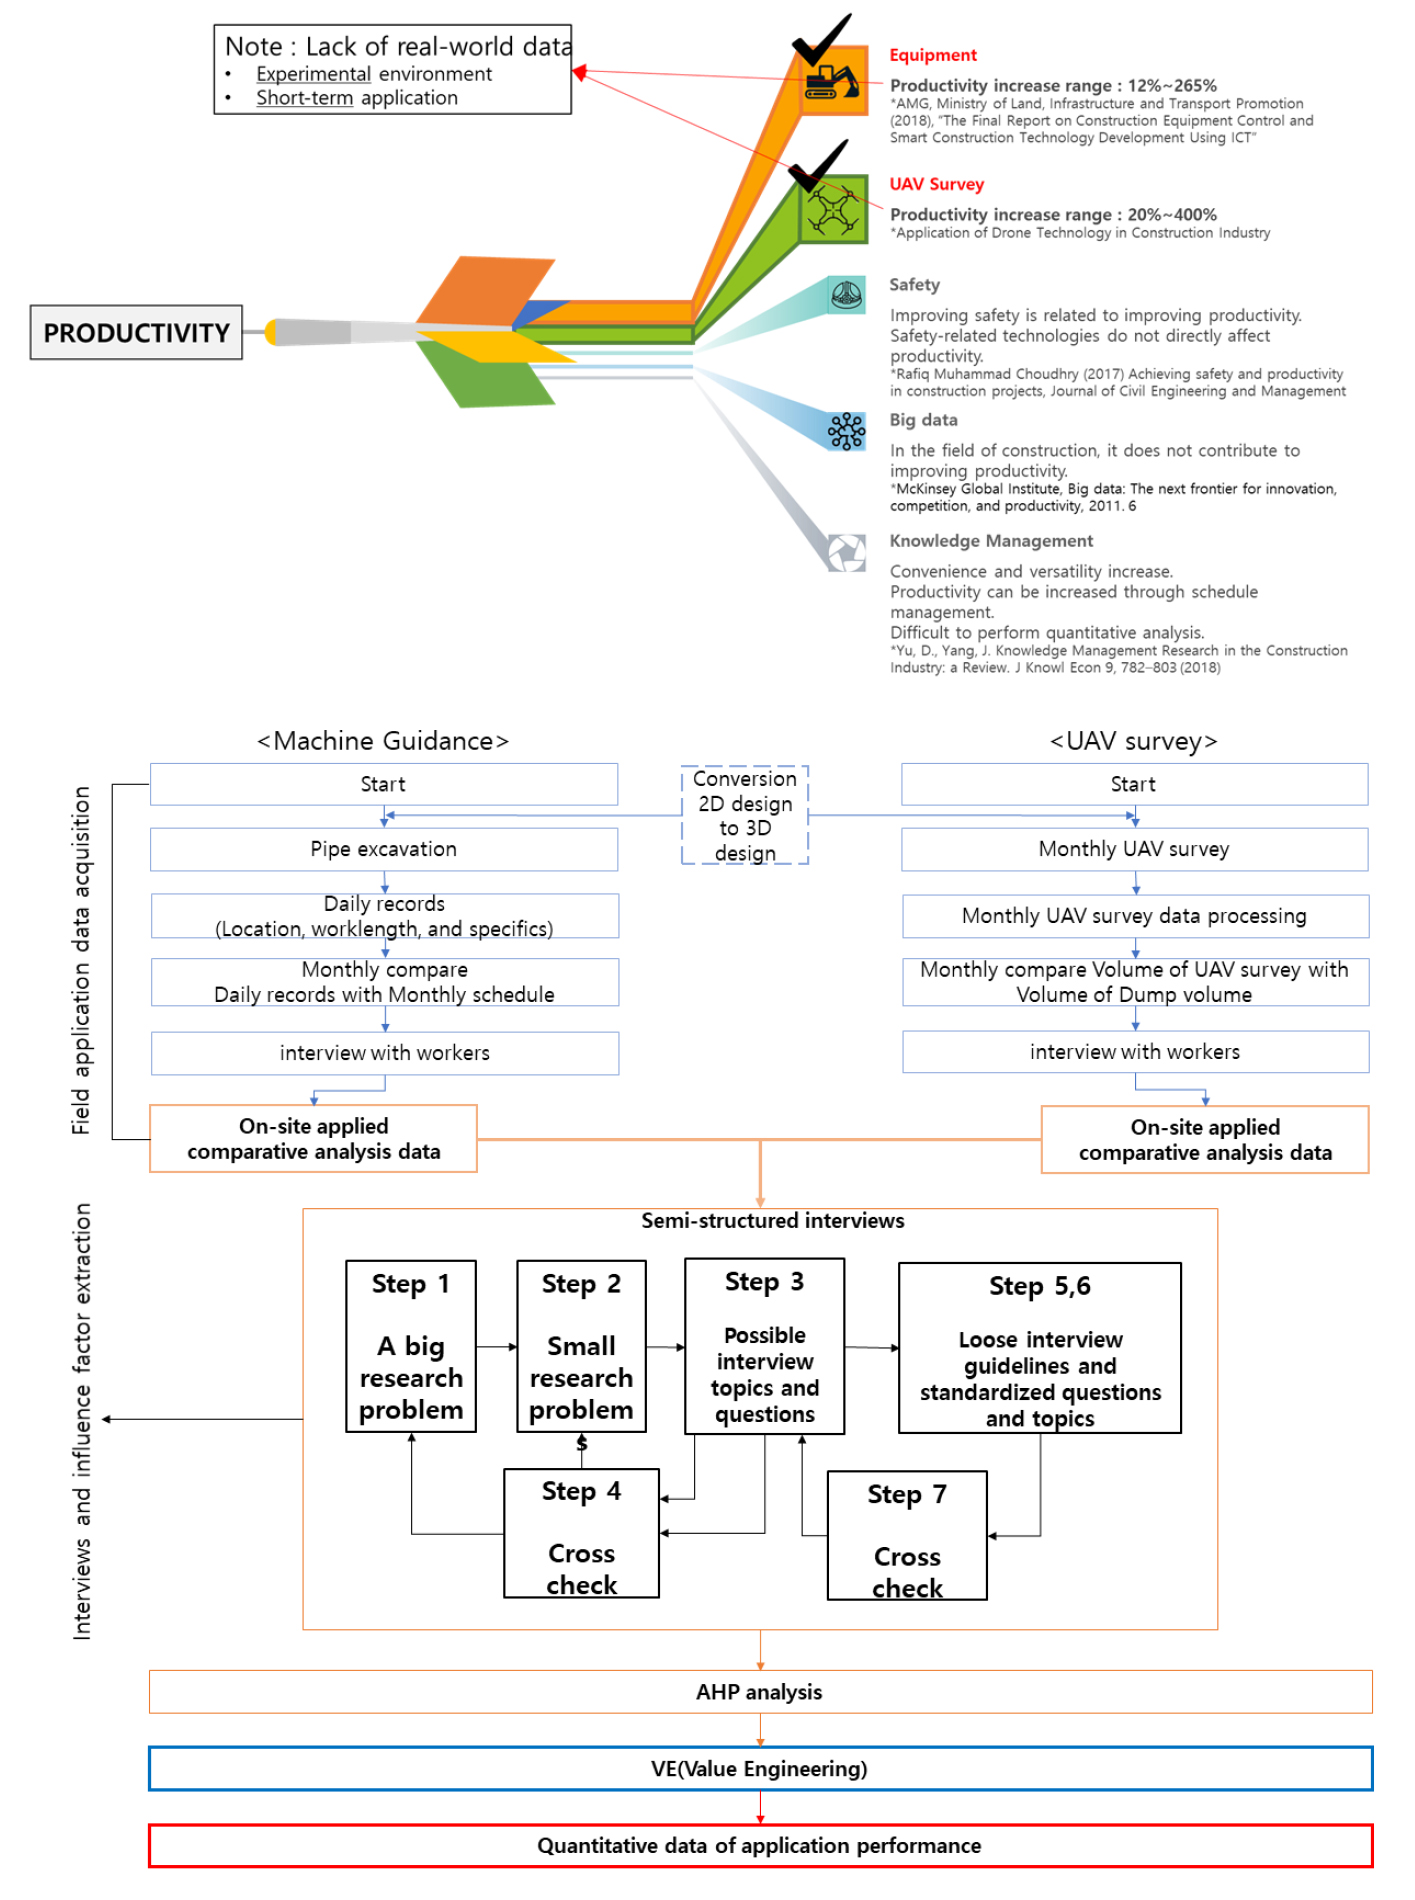
Productivity analysis data and accuracy analysis data in a short-term, experimental environment do not provide an exact basis for determining the actual technical application. Therefore, in this study, value analysis is conducted based on long-term field applied data of ICT technology. This can provide a solid basis for deciding to apply ICT technology in the actual field.
Among the ICT technologies, machine guidance technology and UAV surveying that conform to the Korean government’s policy roadmap were adopted as field application technologies. Based on the actual application of the technology, the in-depth interview of the relevant technology is conducted for the expert along with the organized data, and the content of the impact is selected by structuring the interview. After that, an AHP (Analytic Hierarchy Process) analysis is conducted to review adequacy and consistency to secure reliability and conduct valuation based on the weight. The result of the value analysis and the long-term field applied data can be used as an application example and basis for early field application of ICT technology (Fig. 5).
2. Literature Review
2.1 Construction ICT (Information and Communications Technology)
2.1.1 Machine guidance system
2.1.1.1 Concept of machine guidance system
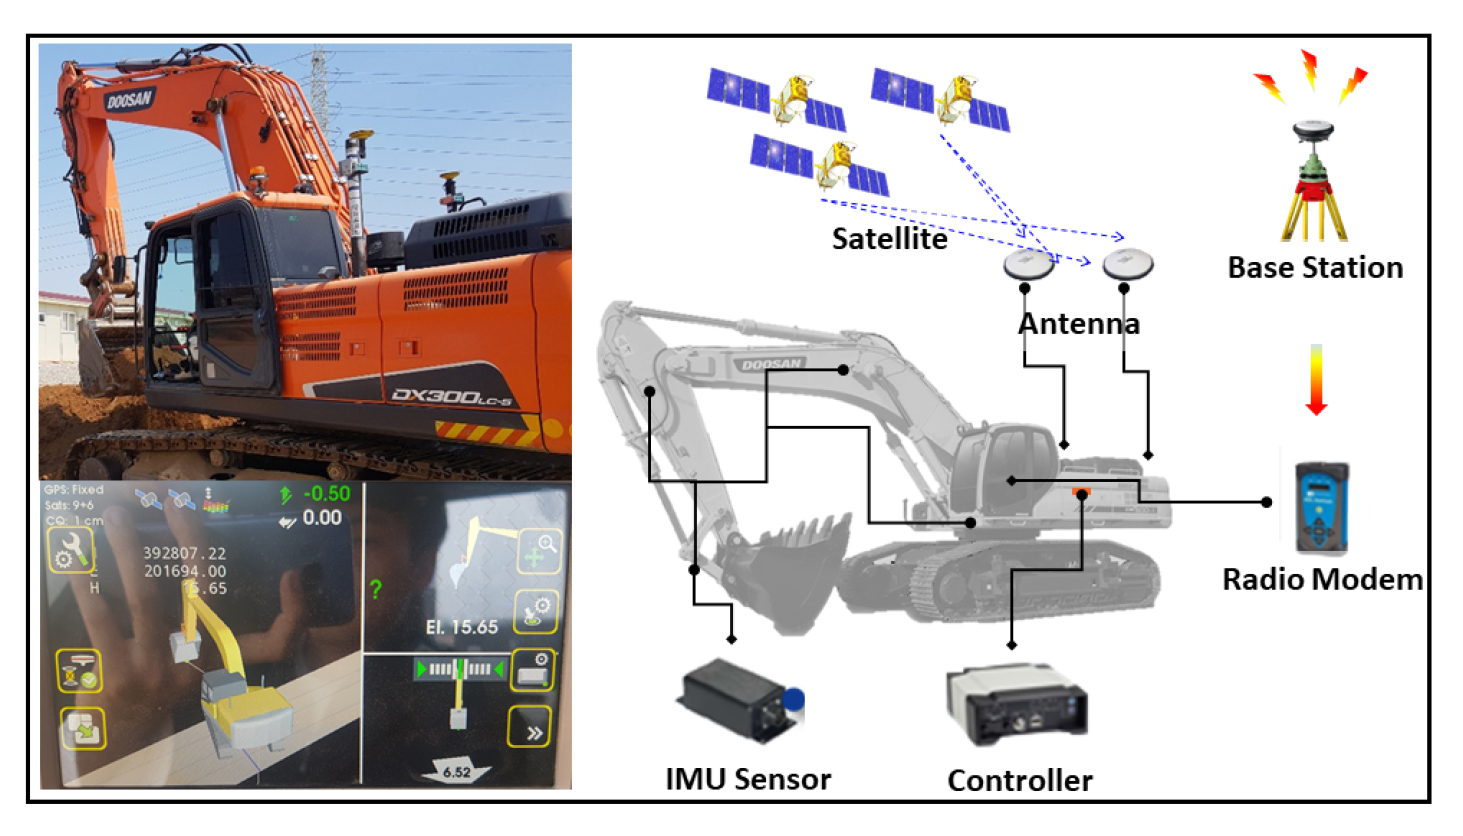
Among the technologies of Information and Communication Technology (ICT) is an excavator machine guidance system that assists excavator operators in their work. For the purpose of calculating the coordinates of the position of the end of the machine in the guidance technology and the automatic control system, a displacement measurement and position recognition technology using a cylinder displacement measurement sensor, a rotational angle measurement sensor and an IMU (Inertial Measurement Unit) were developed (Baek et al., 2017). Fig. 6 shows the configuration of the machine guidance system and the actual installation.
Machine guidance technology shows the position coordinates of the excavator in real-time to the driver and displays the working space and the amount of work according to the design drawings in the actual field. In the conventional excavation method, before starting the actual excavation, the coordinate values of the planned excavation section of the design drawing are obtained to install a file or a survey marker to mark the guide and start excavation. Also, in the construction process, quality is checked through continuous surveying. This work is included in the work time and increases the air of the actual earthwork. The 3D machine guidance system is a technology that can dramatically reduce the inefficient process and improve the fundamental productivity of earthwork (Yoon et al., 2016).
Also, there is no need for surveying and survey assistants during construction, and the possibility of rework is reduced and the productivity of the work is increased, so it is possible to maintain a constant quality of excavation.
2.1.1.2 Productivity of machine guidance system
In Fig. 7, Most of the equipment vendors indicated a potential productivity gain of around 40% and potential cost savings of about 25 to 40% using AMG. On the other hand, most of the contractors indicated potential productivity gains of about 10 to 25% and potential cost savings of about 10 to 25% using AMG (National Academies of Science, Engineering, and Medicine, 2018).
In addition, according to Table 2, according to the results of two productivity analyzes with and without machine guidance, the test reflecting the same conditions as the actual field showed a productivity increase of 18-22%. In tests conducted under experimental conditions, productivity increased by 43% (Ministry of Land, Infrastructure and Transport, 2018b). This is very similar to the productivity data found in the US AMG in Fig. 7, which is believed to be reliable.
However, the experiments shown in Table 2 and Fig. 7 are the results of testing in a short-term equipment operation in an experimental environment. In the case of Table 2, in order to reflect the same conditions as the actual site, in “Real environment”, the test was conducted by exposing it to weather conditions such as the creation of a work ramp, secondary earth-carrying work, curved slope, elution, and typhoon. On the other hand, in the case of “Experimental environment”, the work entry path was prepared in advance with experimental conditions, and the volume of earthwork was adjusted so that there was no secondary earthwork, so that the environment was prepared for productivity. In Fig. 7, the machine guidance technology of various heavy equipment measures productivity and cost, but for the performance of the equipment itself, it maintains an experimental environment with various external factors removed. And in the AMG report it appears that it is an important aspect and must be further investigated to properly understand the impact of AMG on the overall quality, productivity, and cost for paving projects.
Therefore, in this study, to make it easy to understand the impact on the entire project when applying machine guidance technology, we record daily data by prolonged exposure to the actual environment, and obtain richer results of application and research based on productivity, cost, and interviews.
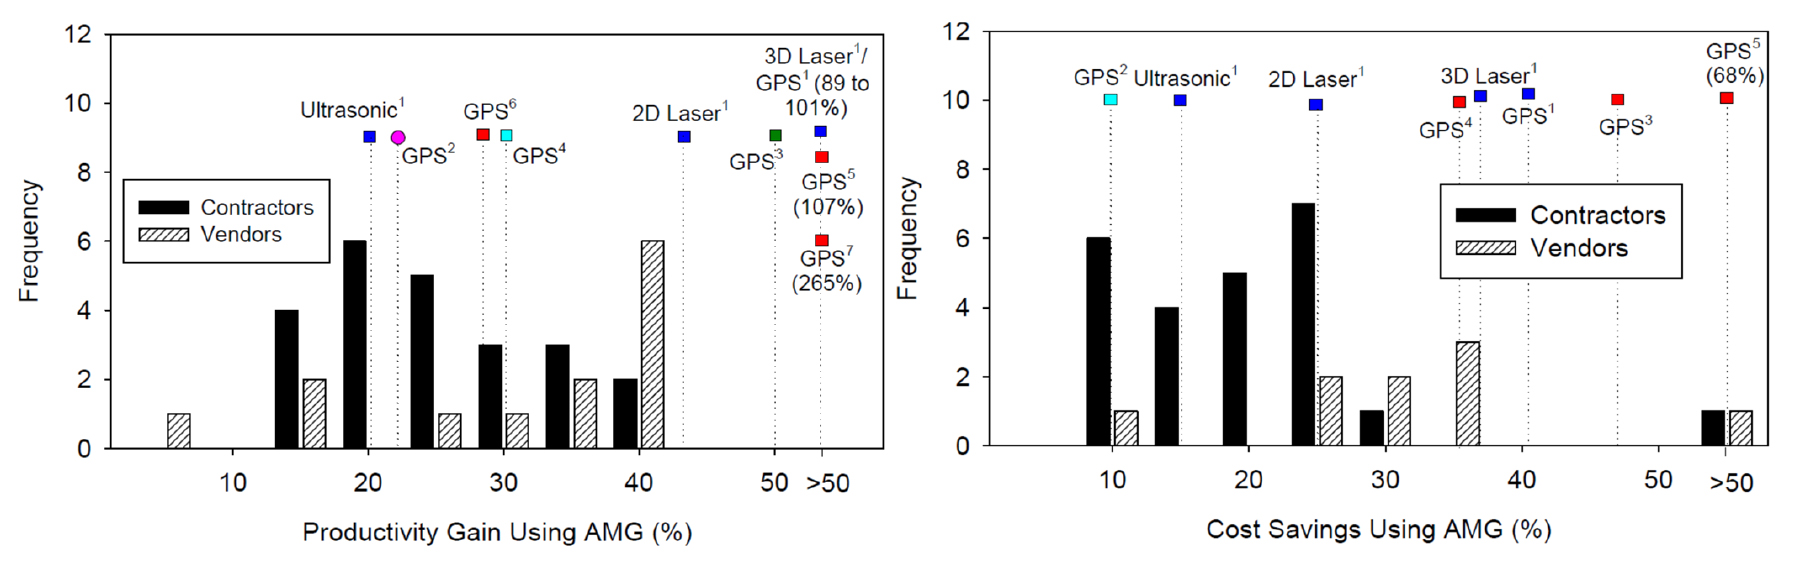
Fig. 7
Results of surveys on contractors and vendors using machine guidance systems to increase productivity and reduce costs (National Academies of Science, Engineering, and Medicine, 2018)
Table 2.
Productivity analysis results (Ministry of Land, Infrastructure and Transport, 2018b)
2.1.2 UAV (Unmanned Aerial Vehicle) Survey
2.1.2.1 Concept of UAV Survey
UAV was included in the 7 new industries of the Ministry of Land, Infrastructure, and Transport in 2016 along with autonomous vehicles and spatial information, and were targeted for fostering new industries. At the 2nd National Science and Technology Advisory Conference in 2018, drones were selected as one of the 8 innovative growth engines for land transportation. Also, unmanned aircraft was included in the Ministry of Science, ICT, and Future Planning’s “Five-Year Plan for Unmanned Mobile Vehicle Development (2016)” (Lee et al., 2020).
Hybrid surveying is an unconventional and unique technique optimized for various types of earthwork design and hybrid surveying, ground modeling technology using drones, and laser scanners for shape information on a wide area. Through this, it is a 3D BIM-based earthwork informatization technology that can implement earthwork building information modeling in a short period, through which it is possible to effectively manage the volume and progress of earthwork (Ministry of Land, Infrastructure and Transport, 2018b).
Used digital photogrammetric methods with aerial triangulation techniques to establish pass, tie, and checkpoints, using known ground control points (established using GPS). These methods provided high-density data with less time consumption, compared to using just GPS surveying methods, and with greater accuracy, compared to analog photogrammetric methods.
Drone surveying is largely divided into fieldwork and internal work and proceeds in the order of plan/GCP survey/UAV survey/analysis/correction/result. As shown in Table 3, the drone’s performance includes the location and number of reference points, GSD (Ground Sample Distance), camera type, shadow, reflective surface (water, snow, etc.), the presence or absence of trees and vegetation, GPS mounted on the drone, It is affected by the processing (software, engineer’s ability).
Table 3.
Factors affecting drone survey accuracy
2.1.2.2 Efficiency of UAV Survey
Set the desired route on the map in advance, receive GPS information with the drone, and automatically perform the survey according to the route, It is expected that the use of construction project productivity analysis, progress check, and quality check will be further expanded (Kim, 2015).
Compared to traditional methods, drone surveying is superior in stability, economy, speed, and visibility. quickly and accurately obtain on-site information, Based on the topographical model, it can be used as visually efficient data if simple status identification, process confirmation, surveying, and earthwork calculation are applied to work (Kang, 2019). Table 4 is the result of qualitative analysis of the efficiency of drone surveying compared to the traditional method.
Table 4.
Efficiency of drone surveying compared to traditional methods (Kang, 2019)
3. Methodology
3.1 Productivity analysis of machine guidance excavator
3.1.1 Quantity of work per unit time through Korea standard product
In the following equation (1), the standard for applying excavator productivity is given in the Korean standard product as follows.
Here, Q : Quantity of work per unit time (m 3/hr)
q : Bucket capacity (m3)
f : Volume conversion factor
E : Working efficiency
K : Bucket factor
cm : 1 cycle time (sec)
According to the above equation (1), the quantity of work per hour is actual work volume divided by time spent on work.
In this study, the productivity of existing excavators and machine guidance excavators is calculated and compared. In order to calculate productivity, information on the total quantity of work and time required for each excavator, and acquisition of work position information is also required for accurate calculation.
3.1.2 Information acquisition and productivity analysis
Table 5 shows information on data that needs to be acquired for productivity analysis.
For the analysis of productivity, the main types of construction of traditional excavators and machine guidance excavators were unified through pipe trenching work. Compared with other types of trenching, the facing of slope and pipe trenching work has less collaboration or interference with other heavy equipment, so it is possible to obtain more accurate productivity data by reducing variables affecting productivity analysis. Among them, facing the slope was difficult to accurately determine the quantity of work of the excavator, so it was decided to pipe trenching work as the main process. The work environment of the site was not experimentally regulated but maintained the same environment as the actual work site. In order to classify the data, basic work sampling was performed as shown in Table 6 in consultation with the process table and site officials before entering the site.
Table 5.
Data acquisition for productivity analysis
Table 6.
Basic work sampling before field input
| Division | Explanation |
| Working time | Cut, fill, and soil preparation |
| Work support time | Work order, equipment movement, survey, refueling |
| Non-working time | Lunch time, other work |
3.2 Unmanned Aerial Vehicle (UAV) survey and volume calculation
3.2.1 Unmanned Aerial Vehicle (UAV) survey planning and data collection
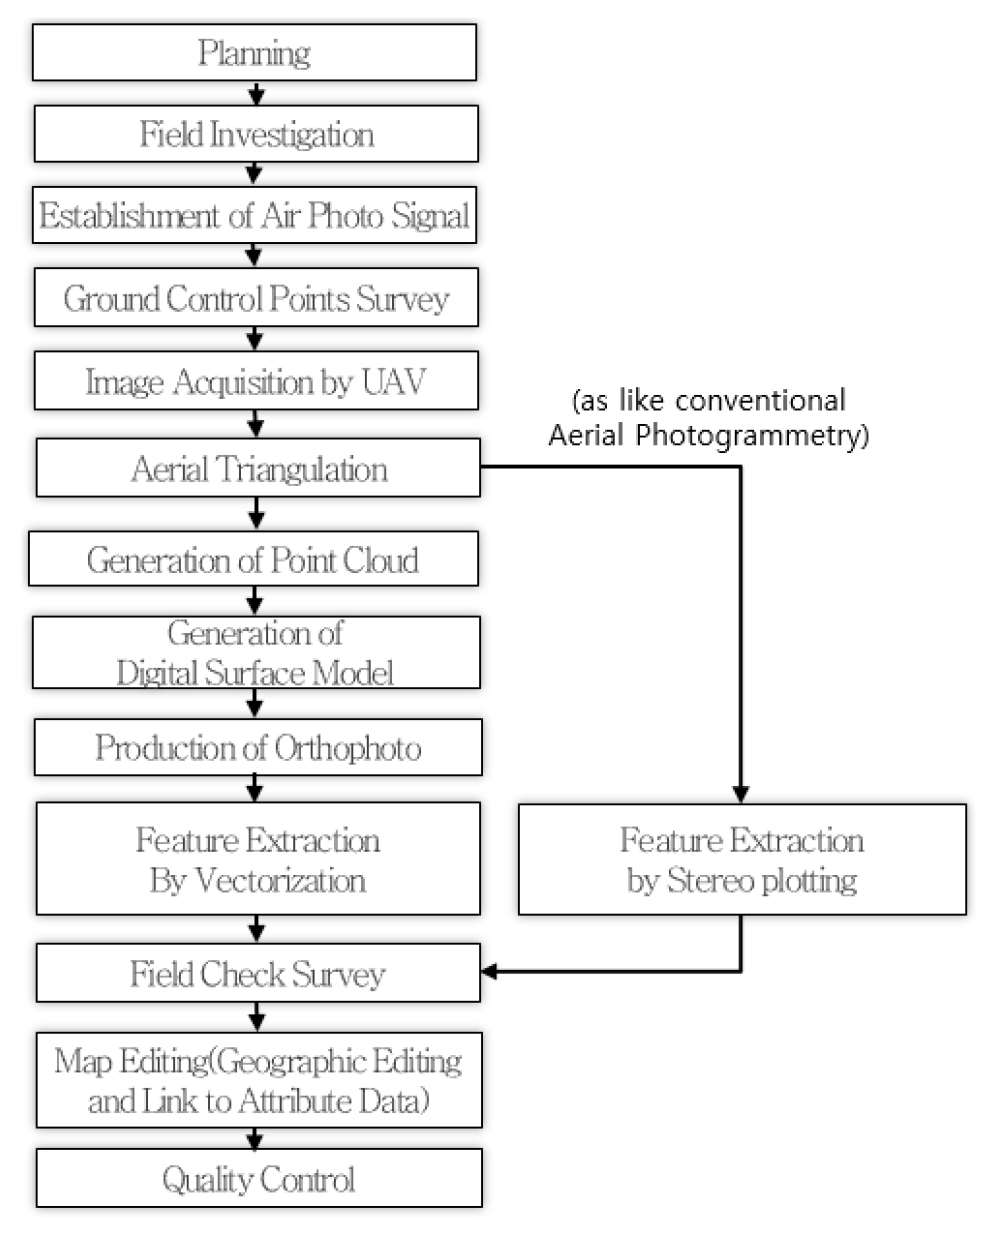
Before UAV surveying, the site’s scale, site information (topography, the altitude of buildings, the scope of the site), and local coordinate systems are checked and weather information is checked to perform survey and flight planning. After that, the GCP (Ground Control Point) survey and UAV photo survey planned at the site are performed to collect the photo data.
When surveying UAV, it is important to ensure that the GCP is well identified, and the vertical and transverse redundancy is set to at least 70% and photographed, and the resulting photographic data is deleted by inspection (such as shaking).
3.2.2 Data processing and analysis
Referring to Fig. 8, point cloud data (PCD) is generated by inputting GCP data and photo data acquired in the field into the data analysis software. Through this, DSM and Orthophoto are created and compared with actual field data to inspect the data and the inspected data is utilized through various analyses. Of these processed data, the PCD undergoes a noise removal process to calculate the quantity and a sub-sampling process to reduce unnecessary capacity. PCD, which has been processed, is comparatively analyzed with a 3D-design file, and the quantity is calculated using the quantity calculation program. Finally, the data obtained in this way are used as ready-made data, survey data, construction management data, and progress management data after determining errors and errors compared to field data.
3.3 Extraction of technology evaluation impact factors using individual in-depth interviews and modified Delphi techniques
3.3.1 Individual in-depth interviews
In this study, individual in-depth interviews were conducted with construction workers. In-depth interviews are useful when you want to get detailed information about an individual’s thoughts and actions, or when you want to delve deeper into a topic. In addition, in-depth interviews provide a context for other data, allowing a more complete picture of the phenomenon. That is, in-depth interviews not only provide a socio-cultural context of the phenomenon but also enable researchers to obtain information about deep, detailed, and sometimes sensitive issues from study participants (DiCicco-Bloom and Crabtree, 2006). On the other hand, in-depth interviews have limitations in that they are limited in time, must be conducted by properly trained researchers, it is difficult to generalize the results, and the interviewer’s bias can be reflected in the interviews. To overcome these limitations, many qualitative studies adopt a semi-structured interview method (DiCicco-Bloom and Crabtree, 2006). Semi-structured interviews have the flexibility that structured interviews do not have (Barriball and While, 1994), and at the same time, researchers can obtain relatively reliable and comparable quality data because they follow clear guidelines (Cohen and Crabtree, 2006).
Therefore, in this study, a semi-structured interview method was adopted to investigate the actual conditions and characteristics of the field of the machine guidance system and UAV surveying technology. This is because, as discussed earlier, the semi-structured interview method was found to be suitable for deeply exploring the reality of field applicability, which is not numerically revealed, and also for acquiring information on sensitive areas such as personal experiences. In addition, data obtained by semi-structured interviewing methods can be compared with each other, so common opinions and special opinions can be classified and organized. Influence factors can be derived.
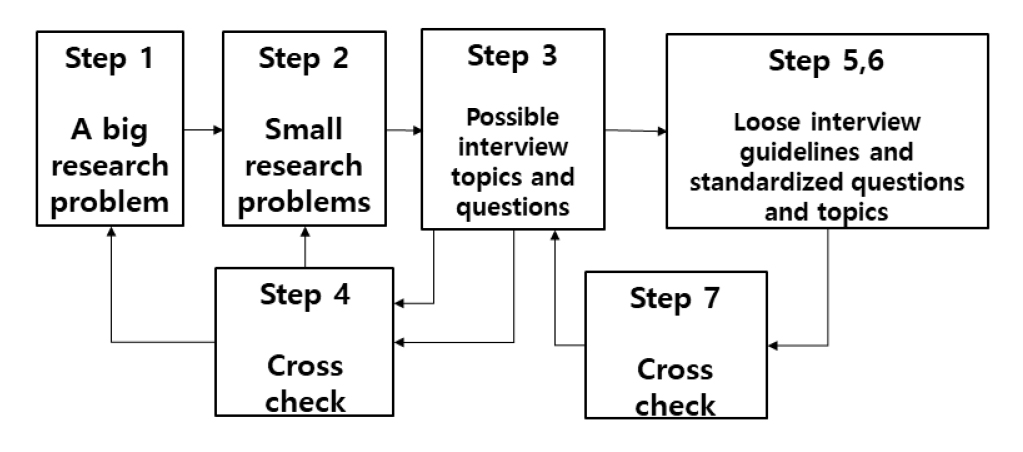
Following the purpose of this study, the performance analysis of field application, the interviewee (panel) was composed of field employees who applied and experienced this technique. Fig. 9 is a semi-structured individual interview flow chart. Interviews were conducted from the beginning of the field to the later stages, and the effects of applied technologies were decided on the subject. According to Fig. 9, the topic and keyword of the question were created by narrowing from a big idea to a small idea, and the content of the interview is updated due to the ongoing interview and information sharing within the field application period. This is the advantage of the Delphi technique, such as ‘a brainstorming process in which each panel can recognize the parts overlooked in the repeated estimation process, resulting in a more uniform estimate’. A uniform estimate can be expected. After analyzing these answers, we select them as a common answer among the panels and use this common answer to extract the technology evaluation impact factor.
3.3.2 Extraction of technology evaluation impact factors using modified Delphi techniques
The modified Delphi technique was developed by. The modified Delphi technique is characterized by utilizing a structured questionnaire from the first survey. This Delphi method has the advantage that it is convenient to investigate and can increase efficiency even with a small recovery (Lee, 2006). After that, the CVR method was used to verify the validity and stability of the study like the existing Delphi method.
One widely used method of measuring content validity was developed by C. H. Lawshe. It is essentially a method for gauging agreement among raters or judges regarding how essential a particular item is. Lawshe (1975) proposed that each of the subject matter expert raters (SMEs) on the judging panel respond to the following question for each item: “Is the skill or knowledge measured by this item ‘essential,’ ‘useful, but not essential’, ‘or not necessary’ to the performance of the construct?” According to Lawshe, if more than half the panelists indicate that an item is essential, that item has at least some content validity. Greater levels of content validity exist as larger numbers of panelists agree that a particular item is essential. The mean CVR across items may be used as an indicator of overall test content validity. For content validity, the degree of consensus can be examined as a content validity ratio (CVR) based on the theory of Lawshe (1975). The CVR is obtained as shown in Equation (2) below.
here, ne : Number of Panels Who Answered Important; N : Total number of panels.
The CVR is based on the assumption that the more panels that are recognized as important, the more the effective rate or coverage of the item increases. In other words, when the number of panelists who answered that any item is important is more than 50%, the item has some validity. If the number of panels that answered that it is important is less than 50%, it becomes a negative value, when it is 50%, it is 0, if it is greater than 50%, and if it is less than 100%, it has a value between 0 and 1, and a value of 1 when it is 100%. Table 7 may determine that only items having a minimum value of CVR according to the number of panels are valid.
Table 7.
Minimum value of CVR according to the number of panels (Lawshe, 1975)
| The Number of Panels | Minimum Value of CVR |
| 5 | 0.99 |
| 7 | 0.99 |
| 10 | 0.62 |
| 13 | 0.54 |
| 15 | 0.49 |
| 20 | 0.42 |
| 25 | 0.37 |
| 30 | 0.33 |
| 35 | 0.31 |
| 40 | 0.29 |
This study attempted to collect opinions of field experts to improve the efficiency of the study by using the modified Delphi technique because to overcome the disadvantages caused by the reduced number of surveys. Therefore, it has the advantage that it can provide convenience and efficiency of the investigation by reducing the questionnaire process by using a structured questionnaire based on the technology evaluation impact factors extracted through semi-structured interviews using the modified Delphi technique. According to the proof of Lawshe (1975), CVR evaluation was conducted to verify the suitability of the selected evaluation indicators through the investigation.
In the Delphi survey, the first thing to be done in order to effectively collect opinions of experts and to derive sincere research results is to select a panel of experts with expertise and prevent the participants from leaving. Therefore, a suitable research target for this study was composed of site managers and experts applying technology. The number of panels in the Delphi survey yielded useful results with only 10 to 15 small group experts. According to the results of this study, 17 field managers and experts were selected as panels for the modified Delphi investigation in this study.
3.4 Valuation Analysis
3.4.1 AHP (Analytic Hierarchy Process) analysis for calculating priority and weight of evaluation items
In general, it has been evaluated that scientific decision-making by quantitative analytical methods is scientific and objective, but in fact, there are cases where it is not. That is, when the comparison scales are different or there is no comparison scale, there is a limitation in that comparison objects cannot be reasonably compared and judged through quantitative decision-making techniques. Complementing the limitations of the quantitative analysis method, the decision-making analysis technique that has been widely used in recent years for the systematic evaluation of alternatives in a complex case with multiple objectives or evaluation criteria, is the hierarchical decision-making method (AHP)to be. The AHP technique was developed in the 1970s by Professor Thomas Saaty of the University of Pennsylvania to improve the inefficiency of the decision-making process in collaboration with the US Department of State’s arms control and world economics economists and game theory experts. As a decision methodology, it is based on the fact that effective human thinking is achieved by ‘the principle of hierarchical structure setting’, ‘the principle of establishing relative importance’, and ‘the principle of logical consistency’ (Cho et al., 2003).
In general, decision-making problems imply the problem of choosing the best alternative under conflicting standards, incomplete information, and limited resources. AHP deals with the problem of prioritizing multiple alternatives evaluated under these multiple criteria, and in the existing decision theory system, it can be positioned as a model with preference correction in multi-attribute decision analysis. In addition, it is a technique to calculate the importance of each alternative by classifying and grasping the importance between goals (Saaty, 1980).
AHP (Analytic Hierarchy Process) is a technique that calculates the importance of each alternative by hierarchically dividing and grasping the importance among target values. It solves by stratifying decision-making problems that include a number of objectives, evaluation criteria, and decision-makers. It is suitable for. In other words, after hierarchizing a given decision-making problem, the priority of the lowest layer is determined by obtaining relative importance or weight by pairwise comparison of elements in the immediate lower layer from the perspective of one element in the upper layer (Saaty, 1982).
The AHP (Analytic Hierarchy Process) is intended to grasp the problem more clearly by decomposing and stratifying complex reality into components to promote a more systematic understanding. The decision-making layer is formed by dividing the problem to be decided into hierarchies by interrelated decision elements, which can be said to be the most important procedure in the hierarchical analysis technique (Cho et al., 2003). In other words, the final purpose of decision-making is located at the top level, and decision-making alternatives are located at the bottom level, and in the middle level, elements are structured according to the influence or contribution from the high-level elements. In general, complex problems are composed of many elements, and most of these elements form a structure, and these elements are usually separated but also entangled with each other. In general, it is impossible to list all variables affecting decision making and to consider them all. AHP (Analytic Hierarchy Process) is a multi-standard decision-making technique based on fundamental intellectual thinking. In the case of the average person, when there are more than comparison elements, it is difficult to compare at the same time. Therefore, the problem is Dismantled so that more factors can be included in the decision-making process, the elements are rearranged within the hierarchical order, and the judgment is synthesized by quantifying the subjective judgment on the relative importance of each variable.
Here, ‘Dismantling’ refers to organizing the problem into hierarchies. This means using hierarchical decomposition as a way to organize problems in appropriate contexts and give them the ability to understand each part within that context, grouping them into comparable groups. The ‘layer’ is a special form of the system, and each element constituting the system forms a divided set according to its characteristics. These sets interact with each other. At this time, each set is called a ‘level’, and the elements in the set must be homogeneous. The theoretical background for the application of the decision model is prepared by the following four axioms, and the details are as follows.
First, The Pairwise Comparison should be able to show the relative importance by comparing two elements under the same criterion, and the strength of this importance must satisfy the inverse condition. For example, if A is X times more important than B, B should be 1 / X more important than A.
Second, The degree of importance of homogeneity should be expressed by a predetermined scale within a limited range, which means that the two elements being compared are valid when they are comparable.
Third, Independence should be independent of each other in terms of characteristics or content that evaluates the importance of contingent importance.
Fourth, the expectation is that all elements necessary for decision making must be completely included in the hierarchy. This means that not only all the alternatives and evaluation criteria considered by the decision-makers themselves are reflected in the hierarchy, but also the belief in the importance of alternatives based on past experience and knowledge. In the middle stage of the hierarchical structure, determinants affecting the final purpose, actors involved in problem-solving, actors’ individual objectives, and policies or means for achieving the objectives are located.
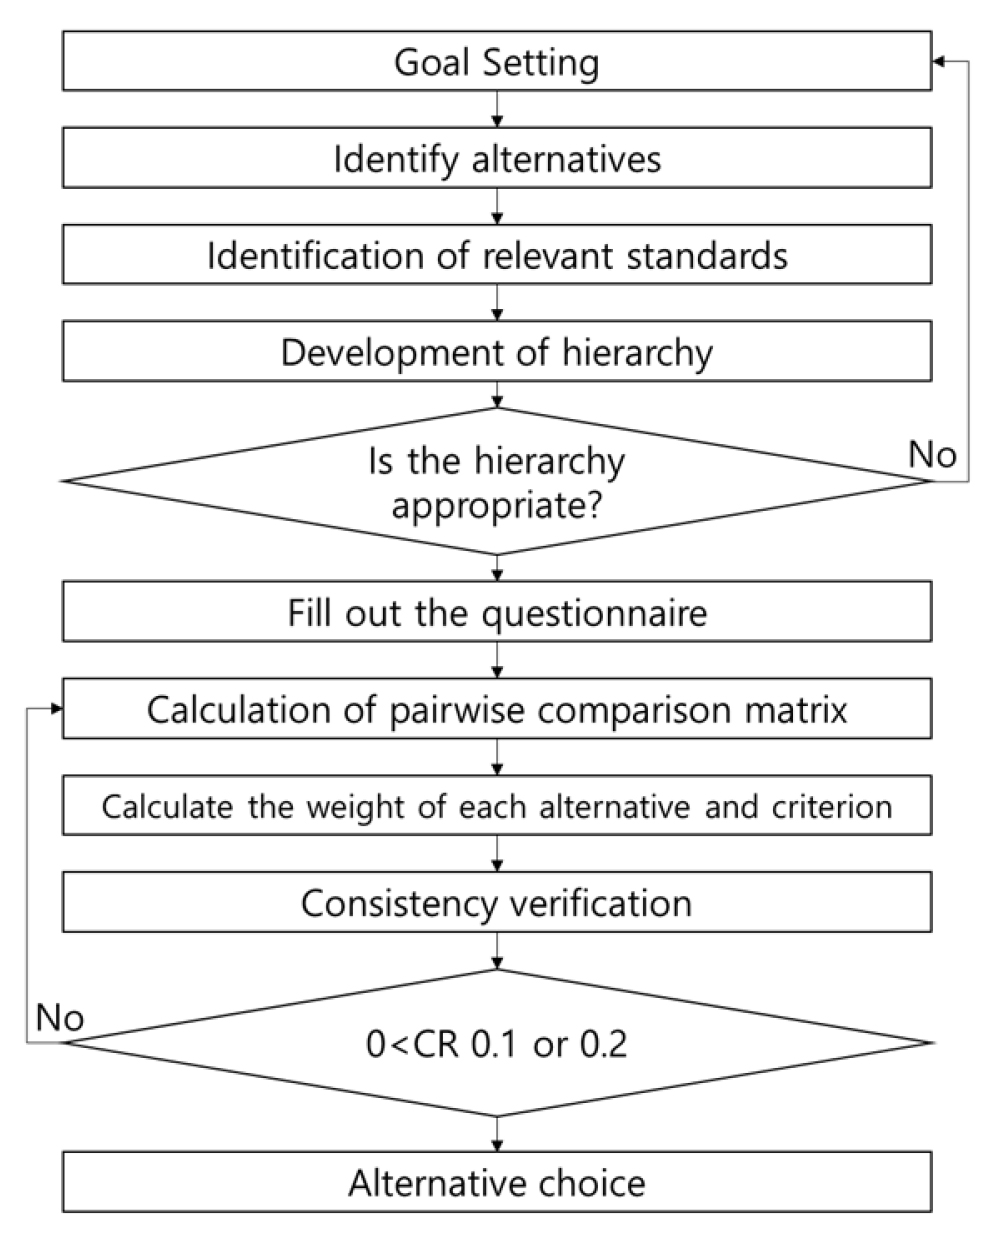
In addition, sub-steps may be formed of each sub-element, and these steps may be corrected according to the situation of the problem. That is, if the problem is simple, it is formed in a hierarchical structure of 3 to 4 steps, but in the case of a complex problem, a complicated hierarchical structure of many steps can be formed. The general application process for AHP in Fig. 10 breaks down a complex and unstructured situation into sub-components. Formulated weights are assigned according to subjective judgments on the relative importance of each component. The highest priority is to synthesize judgments to determine the factors necessary to achieve the desired result (Saaty, 1982).
In order to calculate the priority and weight of the final evaluation items, the AHP (Analytic Hierarchy Process) survey was conducted for 5 experts through direct visits or e-mail. In the AHP survey, even if the characteristics of the group with practical knowledge and professional experience are homogeneous, less than 10 persons are sufficient. The group of five experts who participated in this analysis did not add the number of experts for the AHP investigation because it could be said that the homogeneity was higher. In addition, it has a high degree of understanding of the questions in the AHP survey, which can increase reliability by consistently responding when pairwised. Considering that it is the calculation of the priority and weight of the evaluation items for the machine guidance and UAV survey, which is a new construction technology, it is more desirable to exclude a group of experts who can enter a strong opinion in a specific area. Various configurations of expert groups should be considered when conducting follow-up studies based on evaluation items derived through this study in the future.
Fig. 11 shows the AHP Investigation Application Flow. In the first step, it is the step of ‘forming the hierarchy of decision-making problems’, which can be said to be the most important stage of the AHP investigation. At the top of the hierarchy, the final goal of decision making is placed. And the lower layer consists of various items that affect the top layer, and the lower the layer, the more specific the content of the item (Saaty, 1982).
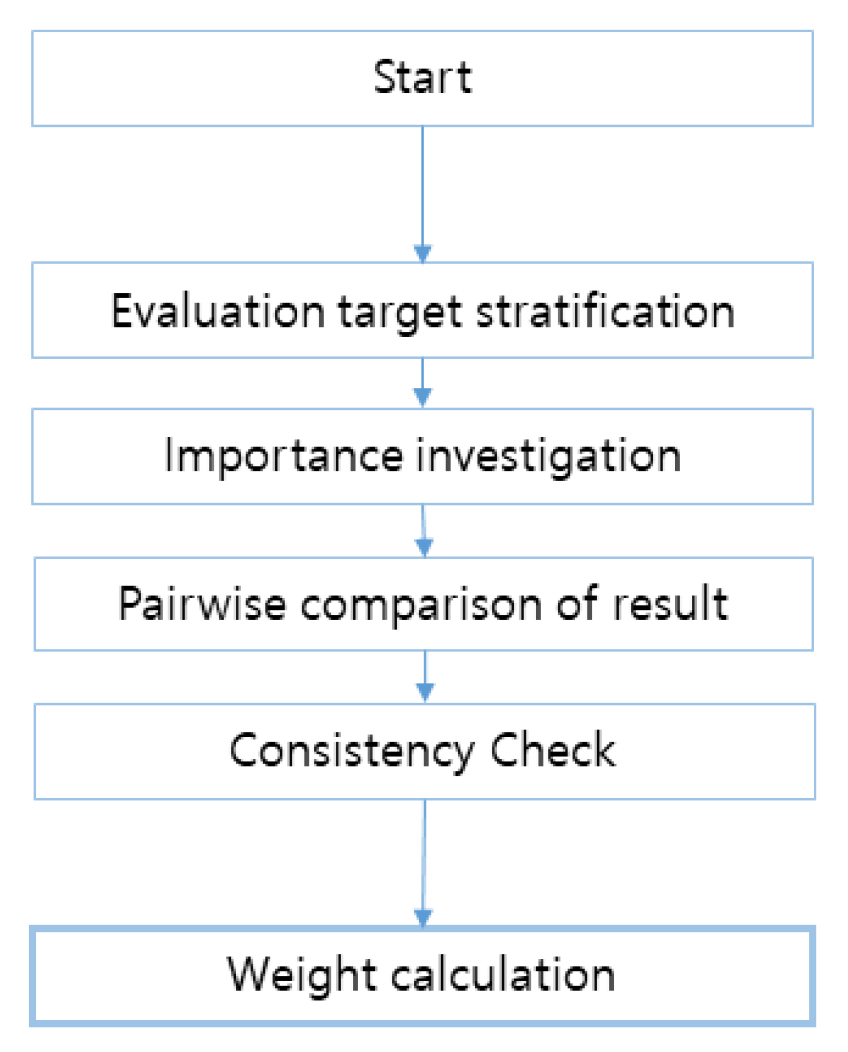
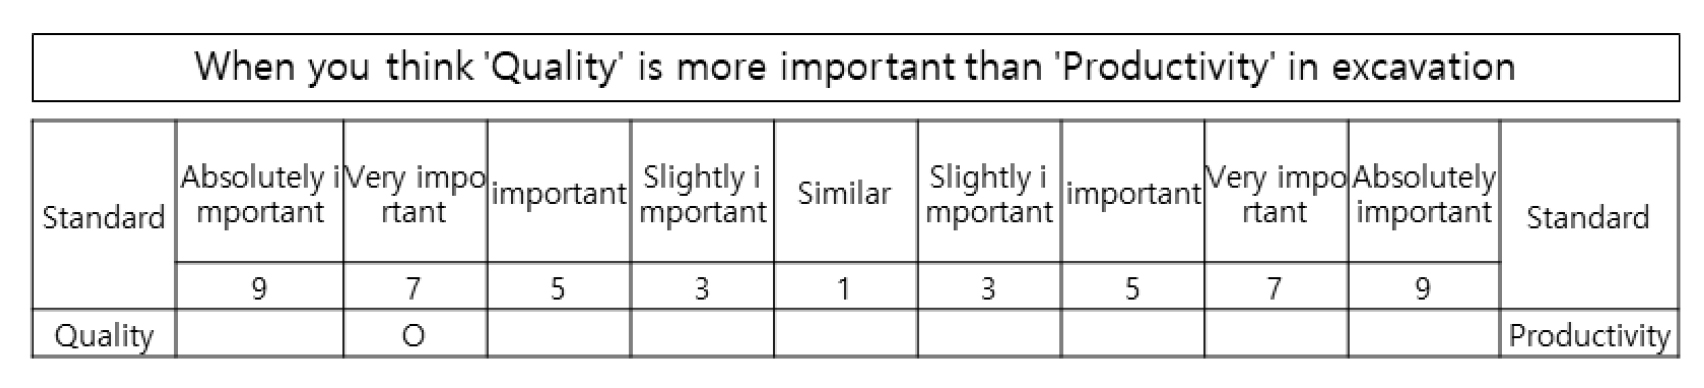
The second step is ‘to perform the pairwise comparison between each item’, and the AHP survey method goes through the pairwise comparison of two of several items. In this case, an evaluation scale is used to quantify the decision maker’s evaluation. The most trusted and most frequently used rating scale is the Saaty (1982) 9-point scale. In this study, the relative importance measurement used for pairwise comparison is evaluated based on the diagonal of the matrix with 9 points as the highest score based on 1 point as shown in Fig. 12. As in the example in Fig. 12, if you think, ‘Quality is very important than productivity in excavation’, the evaluation is made on the 7-point scale on the left. By evaluating the items of each level for each level, the importance of items at the same level is compared and compared. In the form of pairwise comparison, the importance of each item is calculated through the characteristic factor, and eigenvalue of each matrix.
The third step is ‘Calculation of the relative weight between each question’. The consistency of the response is very important in the result of the pairwise comparison of the two-level expert group, which determines the reliability of the response. Perfect consistency, which is a match of the complete response, is difficult to be observed in actual investigations, and in particular, in the case of AHP investigations, the incompleteness of judgment should be considered because it includes subjective measurement of expert opinions and experiences. It is AHP that the Inconsistency Index, which checks whether the logical consistency of the respondents is maintained and whether the rationality and logic of decision making, is derived in the process of integrating 1:1 comparison results using the eigenvectors of the comparison matrix. It is one of the great advantages. In general, when the inconsistency rate is the inconsistency index divided by the random index exceeds 0.1, it is determined that the decision-maker is losing logical consistency and sends a signal to recheck the decision-making process. In the case of such inconsistency, it is recommended to continuously review the responses until the consistency is secured. Three levels of weight calculation are performed using the data with consistency (Andrew, 2013).
The final step is to ‘prioritize the relative weight of all items’ to select the priority of all items in the lowest level, which is calculated by synthesizing the weights of each tier derived in step 3.
4. Case Study
4.1 Process
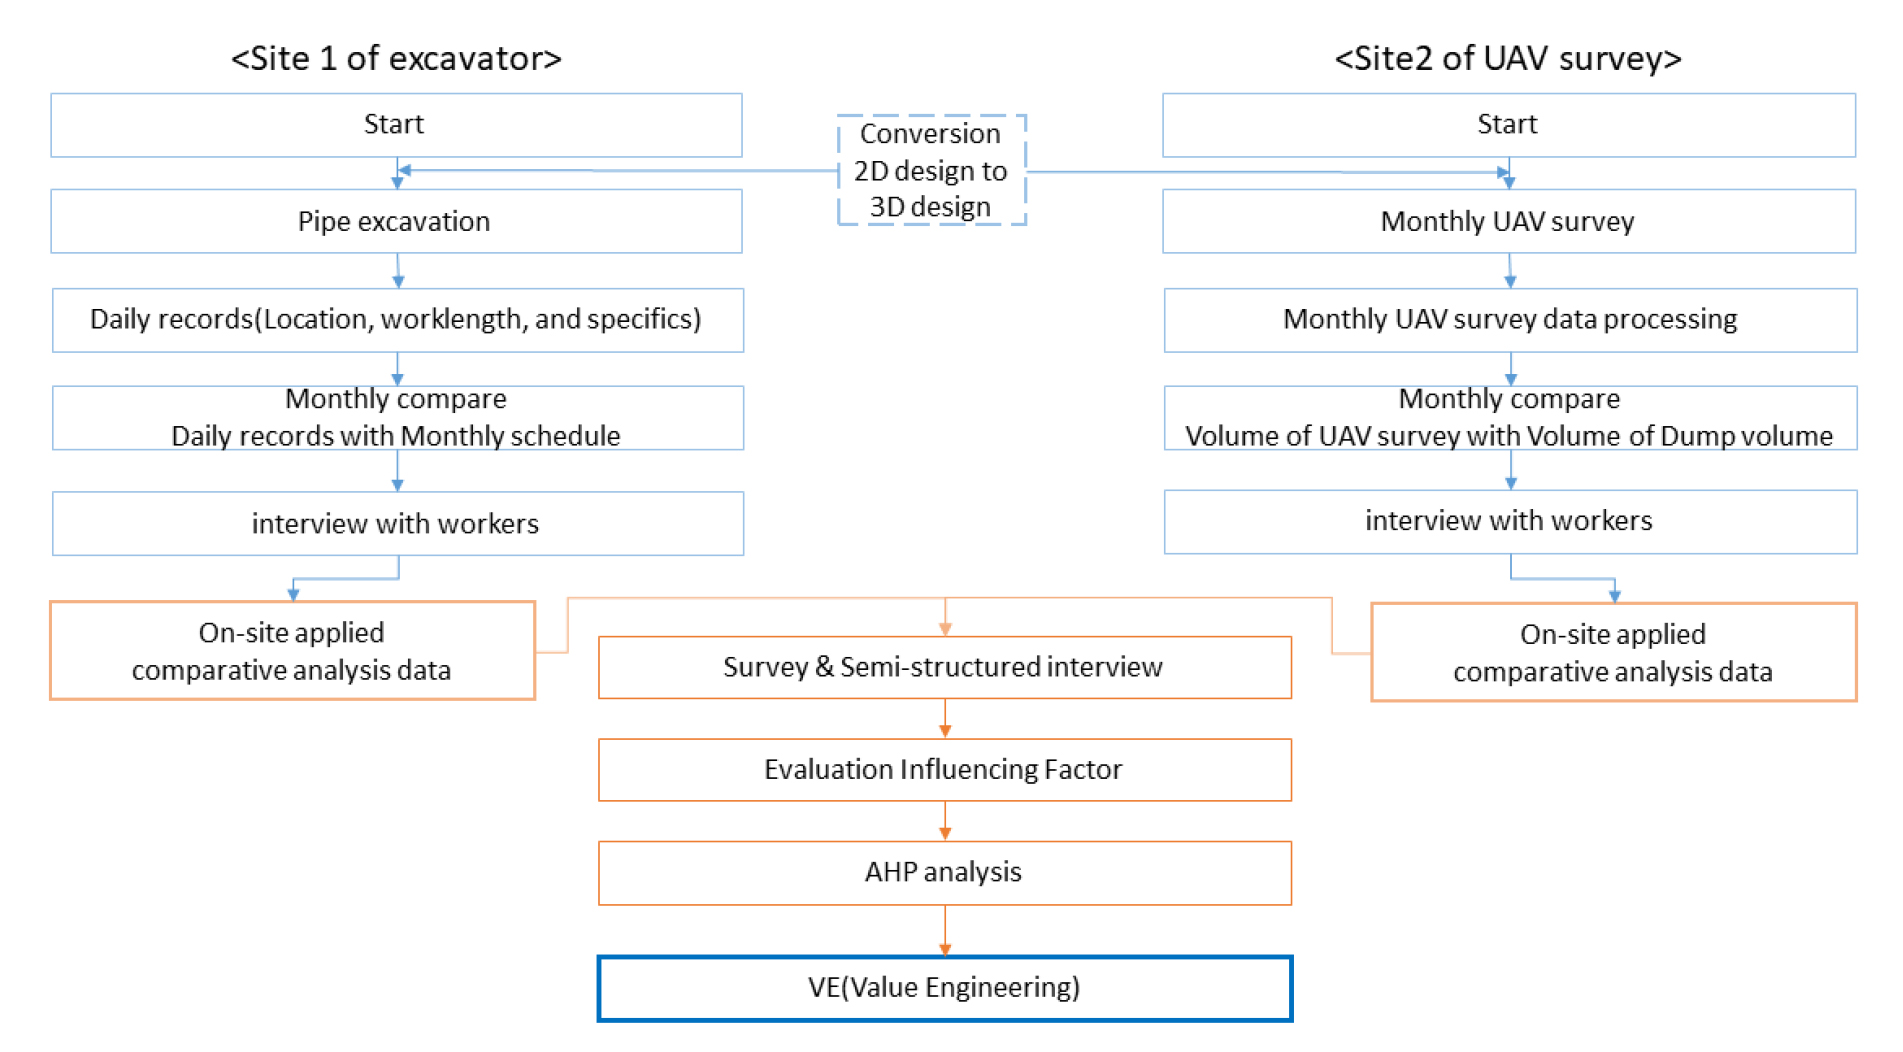
Fig. 13 is a Case Study Process Flow Chart. The applied sites were divided into machine guidance application sites and UAV Survey application sites, and each site-applied data was analyzed quantitatively (productivity, quality, cost). The quantitative data was fed back to the site manager for a semi-structured interview. The results of the semi-structured interview were summarized to extract the technology evaluation impact factor, and the CVR assessment was conducted to verify the suitability of the selected technology assessment impact factor through the 3rd Delphi survey. Then, the weighting and rating of each technology evaluation impact factor are calculated through rating evaluation and AHP analysis through experts, and finally, the value analysis is performed.
4.2 Machine guidance application site
4.2.1 Site Overview
The working type of the excavator was selected as the type of pipe trenching work for accuracy in productivity analysis. The pipe trenching work process is different from other work types in which dozers and excavators work together, so the work is done with only one excavator in one work area. This is because errors due to the interference of other equipment can be reduced.
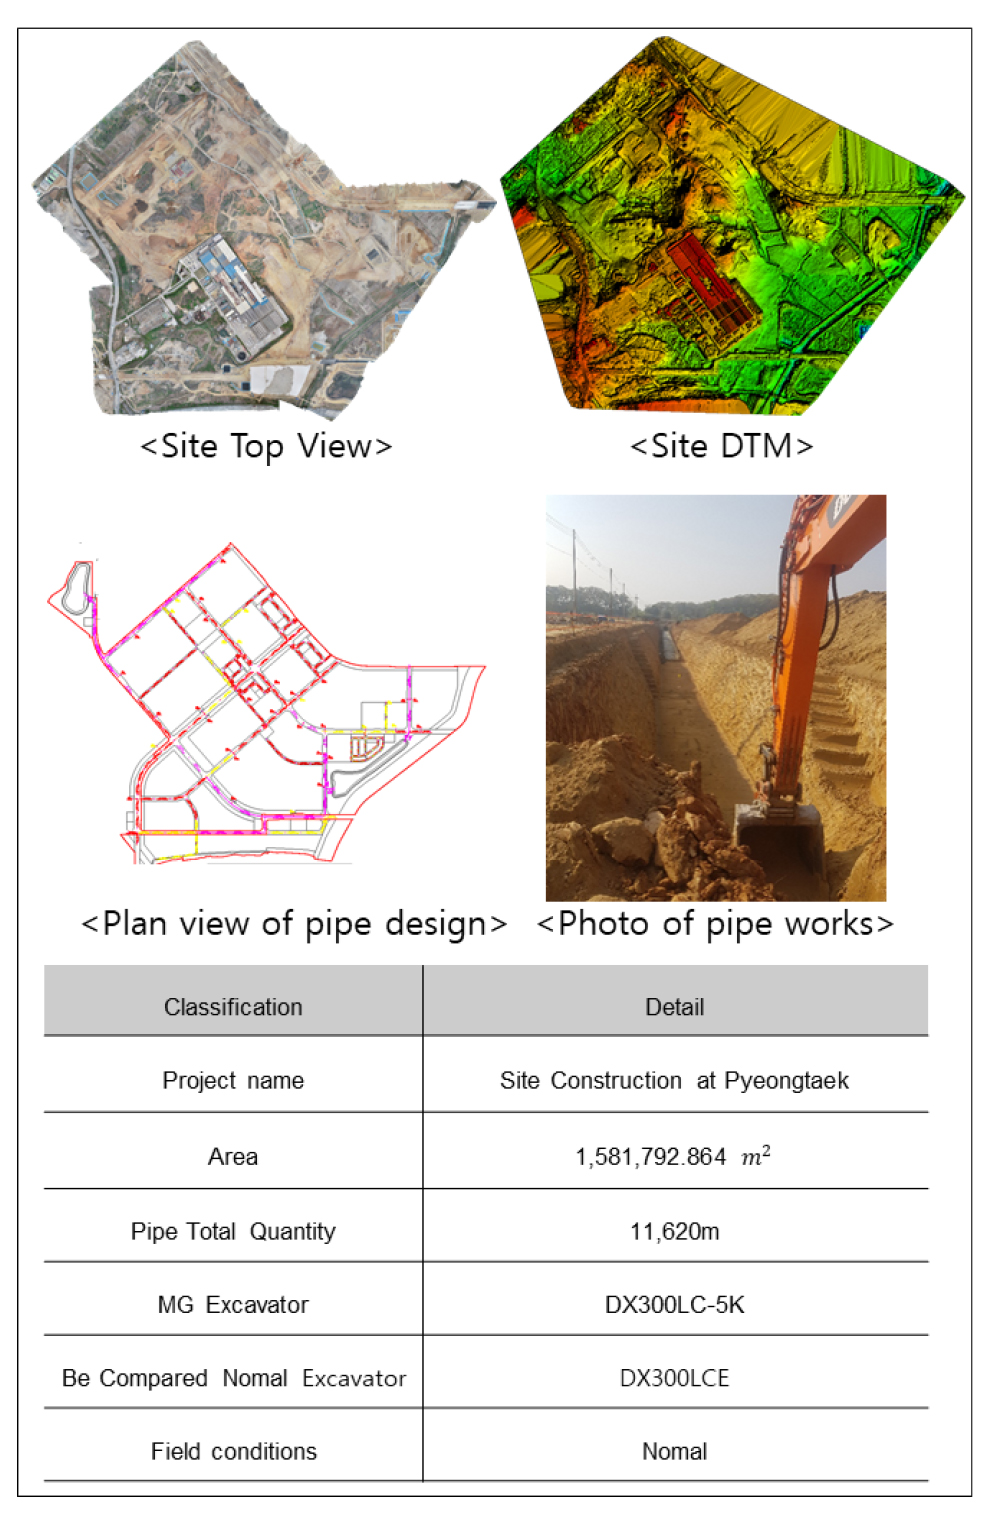
Fig. 14 briefly shows the information of the machine guidance application site. The site is relatively flat, and the condition of the ground is mostly composed of earth and sand, so the workability was found to be moderate. The total design area is 1,581,792m2, which is a construction site located in Pyeongtaek City, Gyeonggi Province. The total design of the rainwater pipe is 11,620m, and a total of two excavators, including a machine guidance excavator, have been used as the main process. The input period is April 1, 2019. ~ January 12, 2020. Is about 9 months. Both excavators are 32 tons (Doosan) and have the same size and bucket capacity.
4.2.2 Machine Guidance Field Application Data Analysis
4.2.2.1 Data collected for field application data analysis
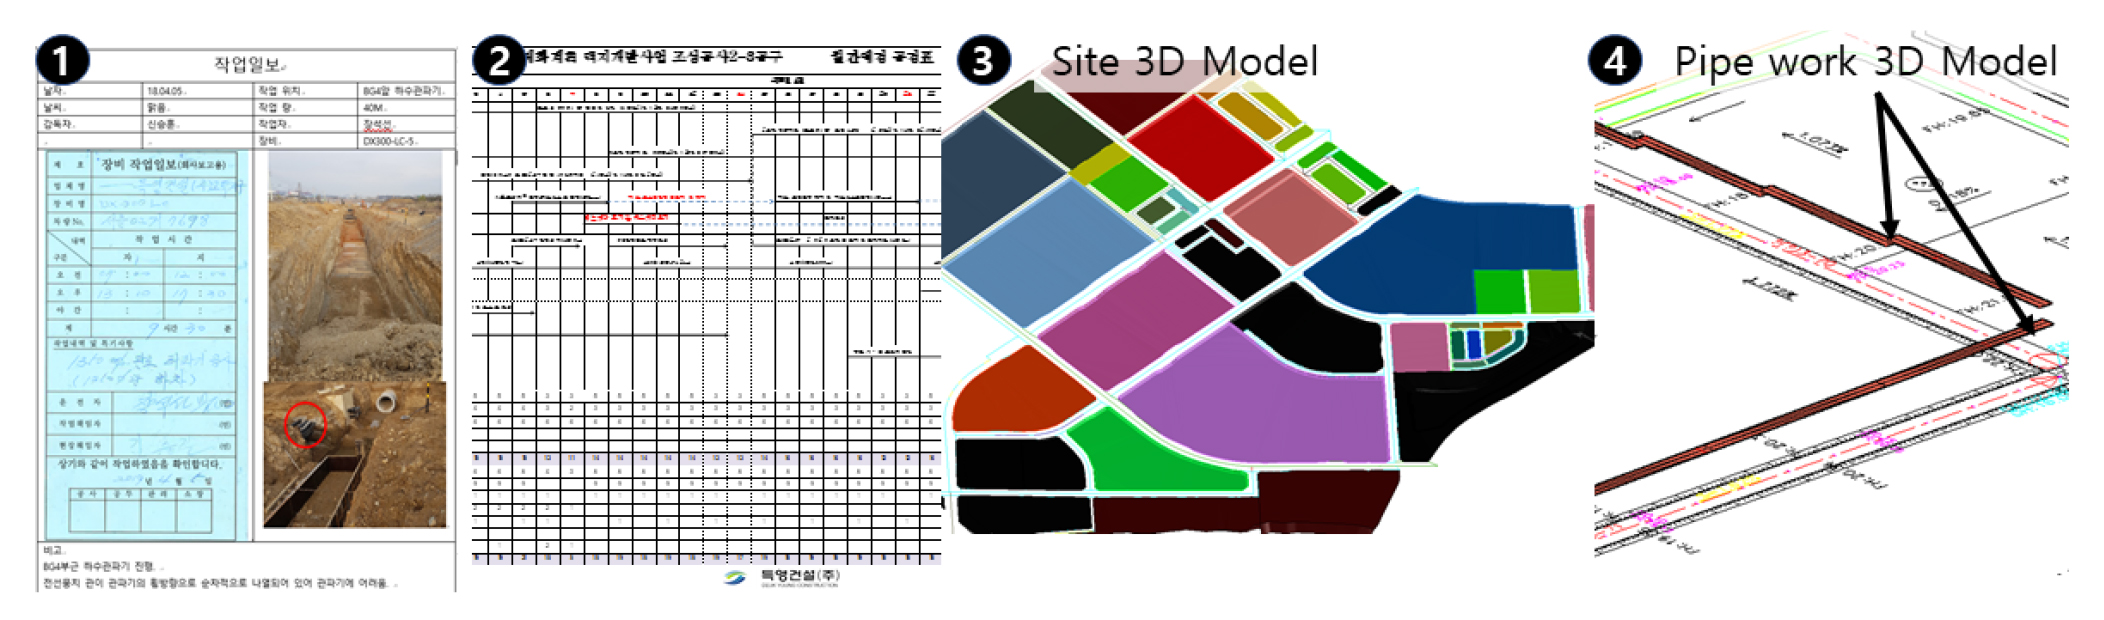
The data collected for analysis of application data in Fig. 15 are as follows.
1) Daily work report : Excavator operator’s daily workload, working hours, and work location are used to analyze productivity data
2) Monthly Scheduled Process : Calculate the quantity of work using the daily work location and 3D drawings by checking the scheduled process schedule
3) Site 3D Model : Calculate expected work volume using on-site 3D design drawings and drone survey data
4) Pipe Work 3D Model : Design required for machine guidance excavators
5) The daily cost of a traditional excavator and a machine guidance excavator
The environment of this application site is as follows. The duration of application for each excavator is 239 days, the main task is pipe work, and the drivers are fifties. The machine guidance excavator worked a total of 6611m during the application period and a traditional excavator worked 5009m. Referring to Table 9, the work during the application period was classified into 10 types, and work sampling was performed. Productivity analysis was conducted only by the date and time of the pipe work of the site.
4.2.2.2 Machine Guidance Excavator Productivity Analysis
Table 8 shows data for productivity analysis in April 2019. As such, daily work volume, work location, work time, and work type were recorded to obtain data for productivity analysis for a total of 239 days. As shown in Table 9, the work of the excavator during the technology application period was classified and recorded by work type. In the case of a machine guidance excavator, 67 days of non-working days out of 239 days, 82 days of excavating pipes, and 54 days (483 hr) of excavating days throughout the day. In the case of the existing excavator, 115 days of non-working days out of 239 days, 65 days of excavating pipes are 65 das, and 41 (365 hr) days of excavating all day out of 65 days.
In order to exclude variables as much as possible, the productivity analysis of the two excavators was compared by the quantity of work and the working time of the day when excavating all day. Equation (3) is used in the productivity analysis.
Table 8.
April work volume analysis table
Table 9.
Number of work days by work type among Total On-site application
As a result of productivity analysis of Table 10, the machine guidance excavator (A) has a quantity per unit time of 159.83m 3/hr, and a normal excavator (B) has a quantity per unit time of 130.11m 3/hr, under the same conditions (q = 1.0, f = 1, E = 0.7, K = 0.9, cm = 19), the standard product (C) proposed in Korea is 119.37m 3/hr per unit hour. The machine guidance excavator (A) showed a 23% increase in productivity compared to a normal excavator (B), and a 34% increase in productivity compared to a standard product (C).
Table 10.
Productivity analysis of machine guidance excavators and conventional excavators
4.2.2.3 Machine Guidance Excavator Cost Analysis
A comparison of input price was calculated by total cost including material cost, labor cost, and cost. Excavator expenses and material costs (oil and consumables costs) were applied to the standard price. However, the standard price of labor costs was different from the standard used in the actual field, so the market price was applied. Currently, the cost of machine guidance equipment has no standard provided by the country, so the following two methods were applied using the market price of machine guidance equipment. 1) How to multiply the machine guidance equipment issue price by the fee, and 2) how to utilize the rent of machine guidance equipment. Table 11 can be used to calculate the total cost of the excavator. The labor cost of survey personnel available during the pipe trenching work process was excluded because it is difficult to calculate accurately. As a result of cost analysis in Table 12, the cost per unit quantity () of the machine guidance excavator is MG (A): 507.95, MG (B): 541.81, Nomal (C): 546.01, Standard product (D): 753.9. Excluding the labor cost, which is the number of surveyors, the MG excavator showed a cost reduction of at least 0.77% to a maximum of 6.97% depending on the MG cost calculation method.
Table 11.
Cost analysis evidence (reason) and calculation
Table 12.
Productivity analysis through cost calculation per unit time of machine guidance excavators and existing excavators
4.3 UAV Survey Application Site
4.3.1 Site Overview
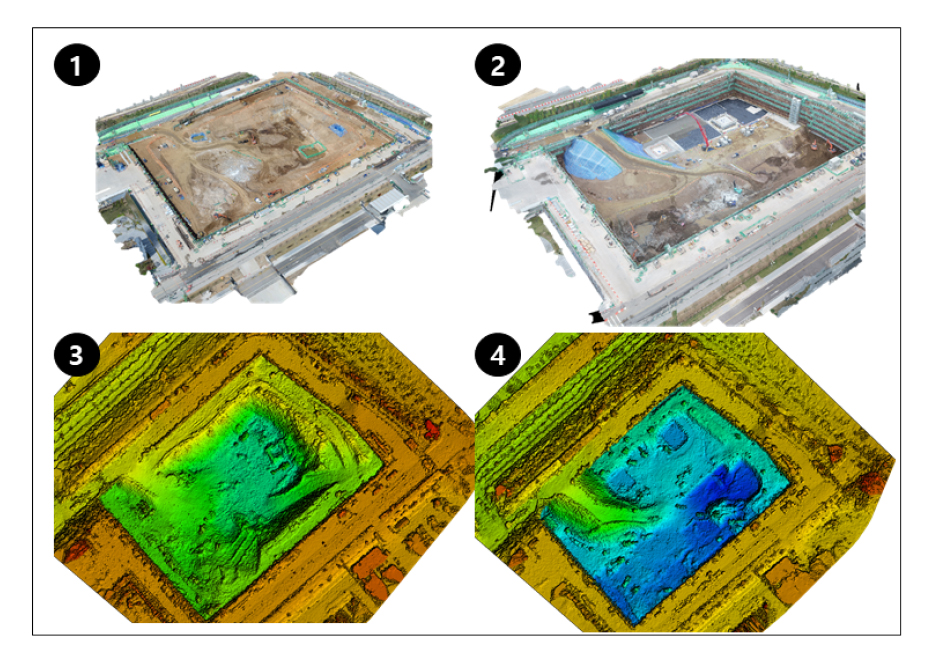
The site was located in Pyeongtaek-si, Gyeonggi-do, and was selected as the construction site for the water purification plant at the complex construction site. The feature of the terrain is that the main process of earthwork is the process of deeply digging vertically due to the characteristics of the water treatment plant construction. The rock was an area that made up about half of the total amount of earthwork. The area is 25,107.87, and vertical height deviations ranged from 4.2m at the beginning of construction to 27.37m at the end of construction. Fig. 16 shows the 3D model and DSM in the early and late stages of construction. The UAV survey application period is 2018.03.08. ~ 2018.08.13. to be.
Construction survey management of the site was conducted by the contractor. The results of subcontractors conducting GPS surveys were compared with those of drone surveys to compare the survey time, analysis time, earthwork volume, and outcomes.
4.3.2 UAV survey effect analysis
4.3.2.1 Data collection and surveying for UAV surveying
The drone survey can be divided into the following. 1) Advance planning, 2) Drone surveying, 3) Drone data analysis. In the pre-planning phase, the construction manager receives the earthwork design and survey data, converts the 2D drawings into 3D drawings for 3D volume calculation, grasps to planing the survey data, and the size and characteristics of the site to locate the GCP (Ground Control Point). The date of the UAV survey should be negotiated with the site manager, taking into account the site conditions, weather forecasts, and deadlines.
For UAV surveying, the planned GCP (Ground Control Point) survey is conducted first, and then the UAV survey is conducted. The UAV flies in the automatic flight mode and sets the redundancy, flight altitude, and flight speed at the judgment of the drone engineer. At this site, the flight altitude was 50m and the overlapping was 80%, and the number of GCPs was used from a total of 11 in the initial stage to a total of 14, adding 3 due to rapid height change in the late stage. Leica’s GS16 and DJI’s Inspire2 were used as survey equipment.
After the UAV was photographed, PCD (Point Cloud Data), orthoimage, and DEM data were acquired using the UAV data post-processing software (Pix 4D). Input data used to obtain PCD are camera information, photos, GCP survey results, and coordinate system.
All information related to earthwork was shared with the construction manager, and all UAV surveying data were verified by comparison with GPS surveying data of subcontracting surveying companies. The frequency of surveying was based on once per month but changed according to site requests.
4.3.2.2 UAV Survey Data Analysis
Table 13 shows the results of the survey data analysis. After the survey data analysis was completed, all the result data was delivered to the construction manager, and the accuracy of all earthwork data and status data was compared with the GPS survey data to compare the accuracy.
As shown in Table 14, a total of seven carry-out volumes and Z RMS errors were compared from demo to 6th, and the average Z RMS error was 2.8cm and the error rate of the carry-out volume was 1.13%. It shows that the error rate increases as the survey order progresses. However, the accuracy of the UAV survey increases as the noise (forest, bush, water, structure, etc.) decreases. Considering the characteristics of the site where the vertical height difference between various structures and the ground is up to 23.37m, it is considered that the quality and data of the UAV survey are reliable. Considering the orthographic image, 3D site model, and high-density status data that cannot be obtained by GPS surveying, there is a great possibility in terms of the effectiveness and usability of the UAV survey.
Table 13.
Comparison of results of GPS survey and UAV survey
Table 14.
Time required for each drone survey (min)
4.3.2.3 UAV Survey Cost Analysis
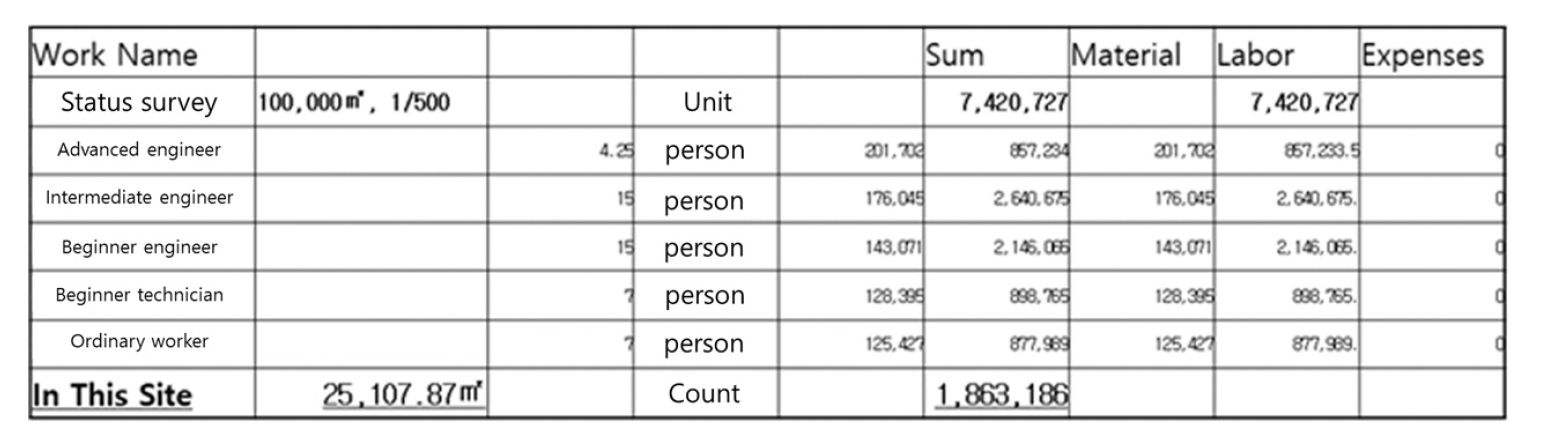
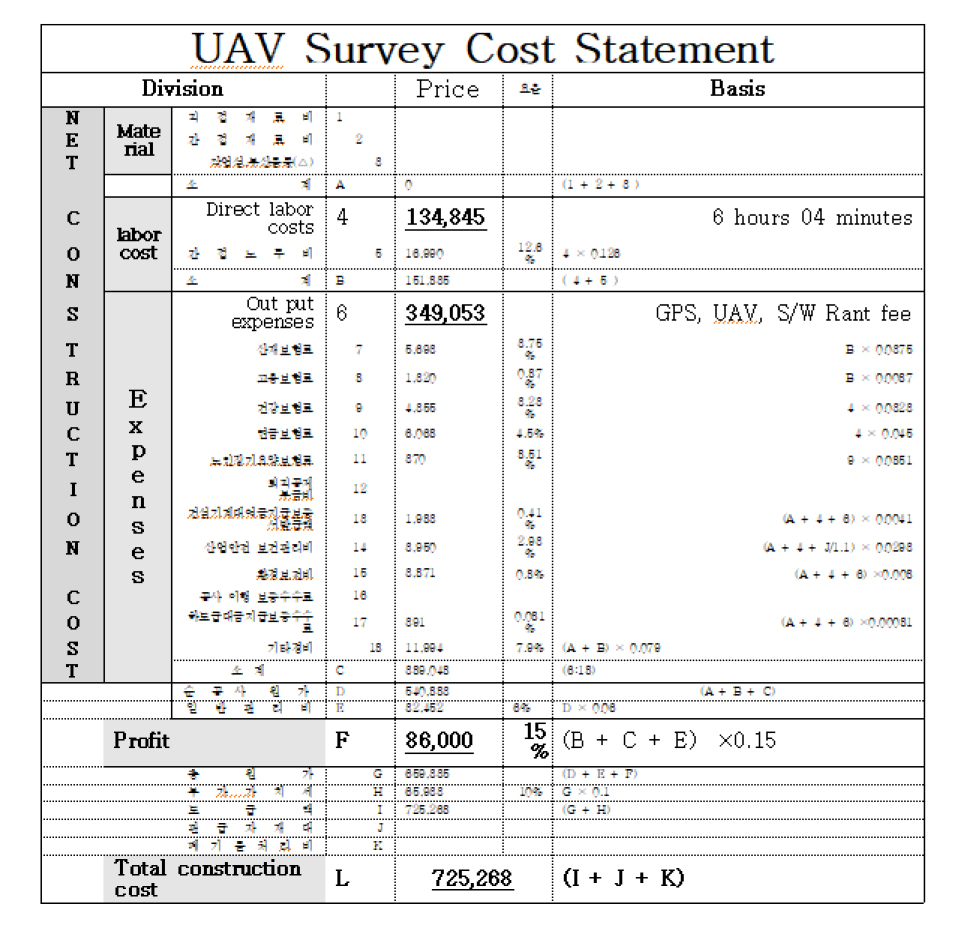
Table 14 shows the work time required for UAV surveying. The time from UAV flight to analysis was recorded to calculate the price of the UAV survey. The average total working time of the UAV Survey is 6 hours and 04 minutes excluding travel time. The maximum travel time is 7 hours and 53 minutes.
In order to calculate the price of the UAV survey, the market price of the input equipment, software cost, and labor cost (average input time * labor cost) is calculated using a cost statement (Table 15), and the total cost is 790,713 won. The labor cost was calculated based on the personnel cost of an intermediate engineer. The cost of GPS surveying was calculated according to the area of the site on a schedule of the price (Fig. 17), and the amount was 1,863,186 won.
Comparing the prices of GPS surveys and UAV surveys, UAV surveys are 57% less than GPS surveys, and the time is 7 days for GPS surveys and 2 days for UAV surveys.
4.4 Derivation of evaluation impact factors using semi-structured survey and modified Delphi method
4.4.1 Interviewee Selection and Semi-structured interview
The selection of interviewees consisted of employees at the technical application site who directly used, managed, and utilized the technology. It was judged that it would be desirable to interview the employees of the technology application site to find out the subject of this paper, ‘the performance of the application in the field’. A total of 17 interviewees, including workers, site managers, contractors, and researchers, were selected for the machine guidance application site. In the case of the UAV survey application site, a total of 15 people were selected interviewees, including survey company, site manager, head office, and researcher.
After applying the applicable technology to the site, questions, and answers during the period of applying the technology were completed until the technology was applied, and official semi-structured interviews were arranged. It is summarized as a common opinion and a special opinion at the application site. Based on the common opinion, evaluation of influencing factors were derived. In table 16 and 17, The questionnaire of machine guidance technology was determined as 11 questions, and the questionnaire of the UAV survey was determined as 11 questions.
Table 16.
Semi-structured interview questionnaire for machine guidance
Table 17.
Semi-structured interview questionnaire for UAV survey
4.4.2 Semi-structured Survey Results and Extraction of Evaluation Impact Factors
4.4.2.1 Machine Guidance Technology Interview Results and Extraction of Evaluation Impact Factors
In Table 18, the common opinions of the semi-structured survey results can be confirmed, and the evaluation influencing factors extracted based on the survey results are 8 in total: productivity, quality, safety, planning, reworkability, durability, manageability, and conformity with the upper plan.
Table 18.
Machine guidance technology interview results
4.4.2.2 UAV Survey Technology Interview Results and Extraction of Evaluation Impact Factors
Table 19 shows the survey results at the UAV survey site. The evaluation influencing factors extracted from the survey results are 8 in total: productivity, quality, safety, economic feasibility, planability, maintenance adequacy, conformity with the upper plan, and technology utilization.
Table 19.
UAV survey technology interview results
4.4.2.3 Derivation of evaluation influence factors using modified Delphi method
The Delphi survey’s expert panel consisted of participants in semi-structured interviews. The Delphi survey conducted was conducted to verify the validity of the evaluation indicators devised based on the semi-structured interview results and at the same time verifying the correspondence between the evaluation indicators. All Delphi surveys presented closed questionnaires. The response scale utilized a Likert-type 7-point scale useful as a Delphi scale. The final response rate was 100% when collecting Delphi survey papers, demonstrating that all expert panels responded with integrity. Finally, the effectiveness review was conducted using CVR indicators. The CVR proposed by Lawshe (1975) is used to conduct a validity review using the panel’s matching agreement. The equation (4) is as follows.
Where, ne : the number of panels that responded important; N : Means the total number of panels
Table 20 shows the CVR results. Since 17 and 15 interviewees were interviewed respectively, the scale of the CVR test was 0.54 or more based on Table 7. As a result of CVR, a total of 6 items were extracted for evaluation factors of machine guidance technology: productivity, quality, safety, planning, re-buildability, and equipment management. A total of 6 items were extracted for the evaluation influencing factors of UAV Survey technology: productivity, quality, safety, planning, economics, and technology utilization.
Table 20.
CVR results of machine guidance technology and UAV surveying technology
4.5 AHP Analysis
4.5.1 Calculation of evaluation criteria (quality model)
4.5.1.1 Calculation of importance through AHP hierarchy and pairwise comparison for calculating quality models for each technology
AHP hierarchical diagram for calculating the quality model for each technology is shown in Fig. 18. Based on the productivity data and cost data of the evaluation criteria selected in this way, the importance of the survey was calculated by five site experts. Materials such as bidding guides, resident survey results, and design data at the site were not provided because they are the site experts who know the site best. Uncertainty was considered when calculating the importance through pairwise comparison.
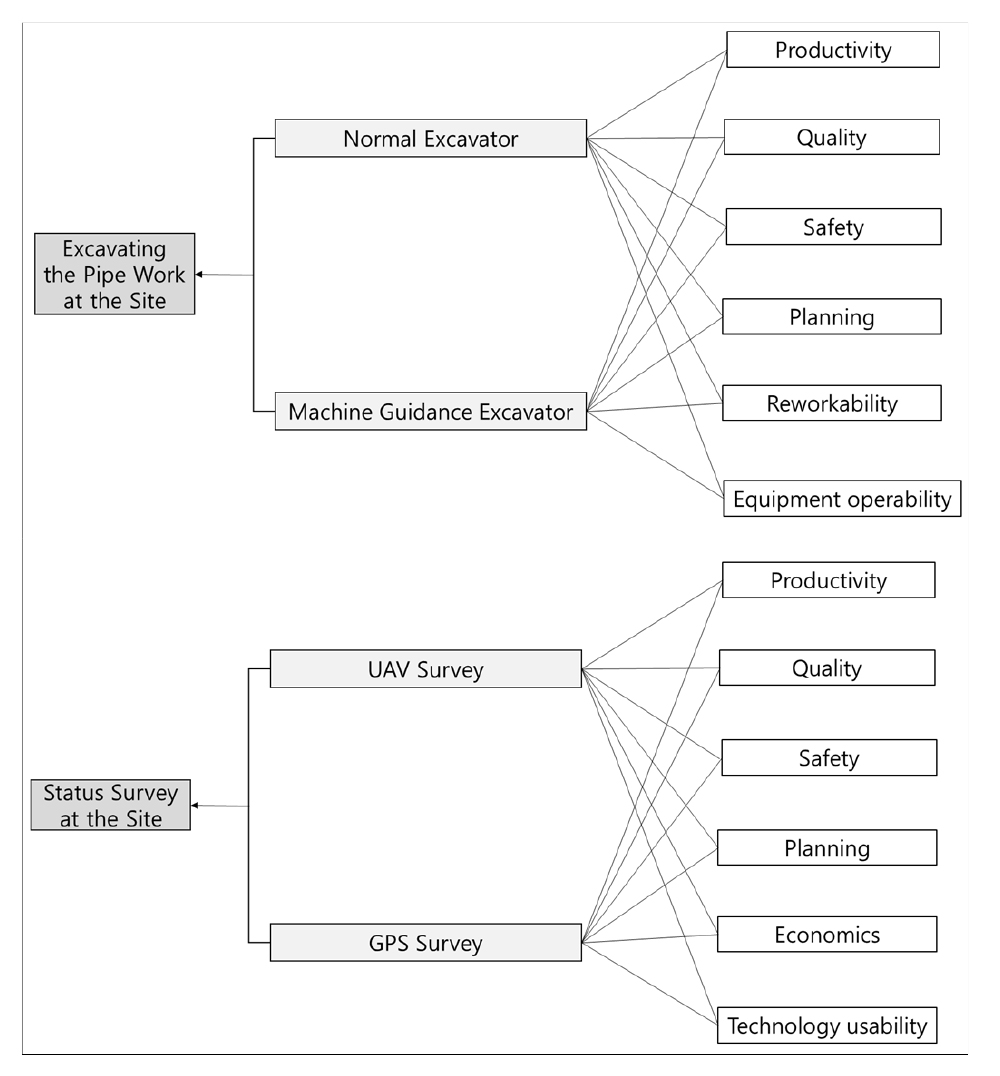
By inputting the results of the pairwise comparison questionnaire to the structured model, the weight for each evaluation influencer was calculated through the pairwise comparison. Table 21 below shows the lower-level weights.
Table 21.
Weight of lower level
4.5.1.2 Writing grading guidelines
It is presented as a 10-point scale for each evaluation influencer (Lee et al., 2003). The grading is performed within the range of scoring that can be given in the performance. The graded score for each evaluation influencer needs to be considered relatively more, giving a score close to 10 points. Finally, the probabilistic characteristic (mean, COV) of the graded value of expert survey results is analyzed. The rating scores of the evaluation influencing factors of each technique are shown in Tables 22 and 23.
Table 22.
Survey results of grading of machine guidance excavators and ordinary excavators
Table 23.
UAV Survey and GPS Survey grading survey results
4.5.1.3 Performance score result
The performance score was calculated by calculating the rating score of the evaluation influencer and the weight for each influencer. In Tables 24 and 25, As a result of the performance score, the machine guidance technology rose by an average of 18.8% compared to the traditional excavator, especially in productivity and reworkability. The performance score of the UAV Survey was improved by 15.1% on average compared to the GPS Survey, and it was confirmed that the economic performance and technology utilization were greatly improved.
Table 24.
Comparison of performance scores for normal excavator and machine guidance
Table 25.
Comparison of performance scores for GPS survey and UAV survey
4.5.1.4 Value evaluation result
Value is defined as the price for a function. For that reason, it is the current technical performance score divided by the price. At this time, the price used is based on the cost calculated when applying the technology site. Because there is insufficient information to calculate the life cycle cost (LCC), the total construction cost is used instead of the LCC index. The cost of an existing excavator is 71,040 won and the cost of machine guidance equipment is 81,185 won. Therefore, the cost index of the existing excavator was calculated as 1, and the cost index of the machine guidance excavator was calculated as 1.143. Besides, the cost of the GPS survey is 1,863,186 won and the cost of the UAV survey is 725,268 won. Therefore, the cost index of the GPS Survey was calculated as 1, and the cost index of the UAV Survey was calculated as 0.389. The result of using this to calculate the value is shown in Tables 26 and 27, and the comparison of performance scores and valuation by technology can be seen in Fig. 19.
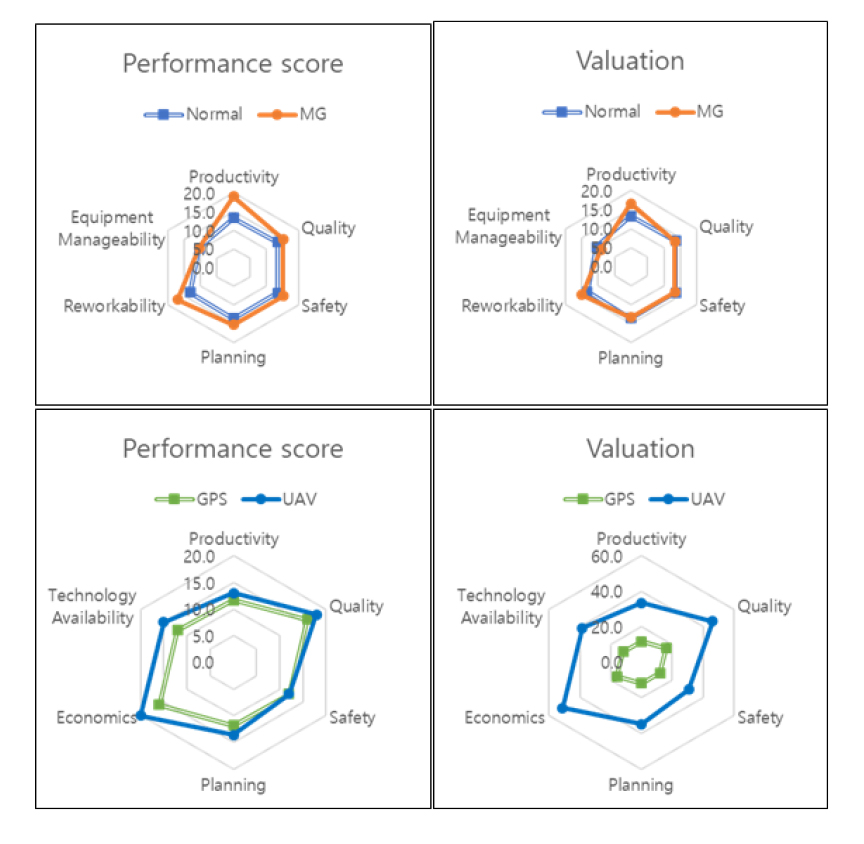
Table 26.
Evaluation result of normal excavator and machine guidance
Table 27.
Evaluation result of GPS survey and UAV survey
5. Conclusion
5.1 Conclusion
In this paper, machine guidance technology and UAV survey technology among new construction ICT technologies were applied to the actual site for about 8 months. And the site manager at the site experienced these results by operating these technologies for about 8 months. Qualitative data was collected by organizing the experience of the field manager through a semi-structured questionnaire, and quantitative data analysis of technology productivity, quality, and accuracy was performed using the data of the field application period. Machine guidance excavators showed a 22.8% increase in productivity compared to normal excavators, and UAV Survey showed that surveying time and data processing time were significantly reduced compared to the GPS survey.
The quality of the result data of the UAV Survey also showed an error of 1.13% on average compared to the GPS Survey, and the Z RMS error is 0.0028m on average, which is very reliable. And according to the result of productivity analysis, the cost per unit quantity of the machine guidance excavator and the traditional excavator is 6.97% lower than that of the machine guidance excavator, but this cost already includes quantitative productivity data. To prevent duplication of results, the total construction cost was calculated at a cost per day.
In the performance evaluation, the average improvement rate of the machine guidance excavator and the traditional excavator increased by 18.8%, and the performance improvement rate of productivity increased by 25%. This is considered to be very reliable considering that the quantitative data of the field productivity analysis of the excavator increased by 22.8%. Even in the semi-structured survey results, the survey showed that the work understanding of workers improved by surveying, re-construction, and visualized drawings during construction has a significant impact on productivity. It is expected that the valuation results of the machine guidance excavator will be further improved if the labor cost of surveyors during construction is not included in the cost analysis. In the case of equipment management, the performance score was the same as that of the machine guidance excavator and the traditional excavator, but it was noted that the semi-structured survey resulted in uncomfortableness due to unfamiliarity with 3D S / W. However, this problem will be solved if the 3D design is performed from the design stage according to the target government policy.
In the case of the UAV Survey, the average improvement rate in performance evaluation was found to be 15.1%, and the value evaluation result was found to increase by 296%. The improvement rate increased in all evaluation criteria except safety, and it was confirmed that the portion of economics and technology availability improved significantly. This is because the initial result of the UAV survey is a 3D model, so it can be used in various fields such as orthoimage, 3D model, video, 3D volume calculation, and linkage with BIM, as well as status data.
The rate of increase in the performance score of safety was expected to improve the safety performance index because the number and time of survey workers going directly to the site were reduced. But it did not increase. As a result of the semi-structured survey, they mentioned that UAV flight, which was not available before, could create a new risk of accident due to the UAV crash.
Quality satisfies the tolerance range of both technologies, and the time required for surveying and the data processing time are significantly reduced. It can be said that the standard of tolerance has the same quality. However, the UAV survey is easier and faster than the GPS survey, which is more manual, so it can be confirmed that the quality of the drone survey is slightly better if data density and follow-up are considered.
The cost portion of UAV surveying and GPS surveying was calculated to be significantly lower in the cost of UAV surveying, which significantly reduces surveying time and data analysis time in the case of surveying where labor costs account for the majority of the total cost.
Lastly, you can see a lot of studies and reports that ICT construction technology can predict the productivity of construction sites, shorten the construction period, and further reduce cost. However, many sites still do not introduce ICT construction technology to the site, and the reason can be confirmed in the semi-structured questionnaire. The main reason for this is who pays for it. Construction work is a project order type of project. The total cost and breakdown of the winning project have already been determined. This is to manage the construction and cash by reducing the variables as much as possible in the field with many variables and risks. Therefore, when introducing new technology, the cost and items of using the technology cannot be found within the project. I think this is why the construction sector has conservative characteristics regarding new technologies.
When construction starts, the designer is already paid for the design work and the contract is over, so he is cynical about the follow-up questions and further work on the design. There is no reason to increase the risk and workload by making new attempts because the construction company has already received and built the project. This is because it starts after calculating the profits of the company before starting construction. Even subcontracting companies do not have to try new things, even if they do construction at an additional cost, the price of monthly payments does not change. However, if there was any information on the use of ICT technology from the time of the project, if the new technology was introduced through VE evaluation at the time of design, the early field application would have been realized if the construction company replaced the existing technology with the new technology.
Quantitative analysis and qualitative evaluation of long-term field application data of ICT construction technology, the result of this paper, provides a reason and reason for considering early field application. The actual application of technology to the field will increase the productivity of construction sites, reduce costs, and solve safety problems, and will accelerate the development of target technologies proposed by the government.
